[转]Performance Analysis Using SQL Server 2008 Activity Monitor Tool
Problem
While looking through the new features and improvements in SQL Server 2008 Management Studio (SSMS) we found a potentially interesting one called Activity Monitor. Database developers and Database Administrators can use Activity Monitor to get a quick overview of an SQL Server 2008 system performance. Can you give us a detailed explanation of how we go about using Activity Monitor?
Solution
The Activity Monitor which is available in SQL Server 2008 Management Studio is a great tool which can be used by database developers and administrators to get a quick overview of SQL Server 2008 system performance. The Activity Monitor tool in the previous version of SQL Server used to display information related to Processes, Lock by Objects and Locks by Process. There are many enhancements in Activity Monitor in SQL Server 2008 like a graphical display of Processor Time, Waiting Tasks, Database I/O's, Batch Requests, Processes, Resource Waits, Data File I/O's and also information about the most expensive queries. However, to view Activity Monitor in SQL Server 2005 and in SQL Server 2008, a user must have VIEW SERVER STATE permission.
Different Ways to Open up Activity Monitor in SQL Server 2008 are mentioned below:
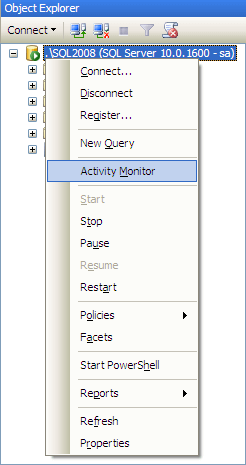
Open up Activity Monitor Using Object Explorer
In Object Explorer, right click the SQL Server 2008 Instance and select Activity Monitory from the drop down list as shown in the snippet below.
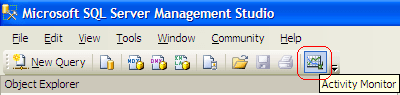
Open up Activity Monitor in SQL Server 2008 Management Studio
In the SQL Server 2008 Management Studio's toolbar, click Activity Monitor as shown in the snippet below.
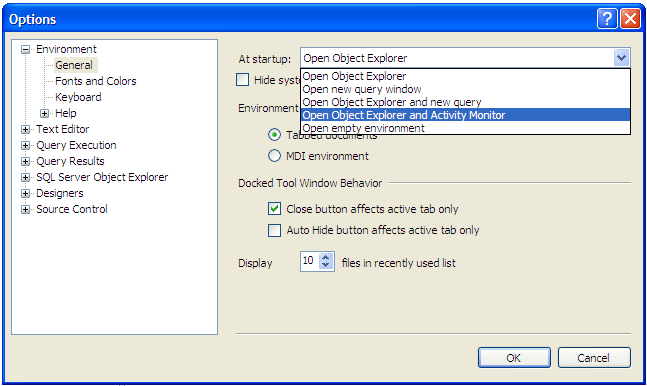
Open up Activity Monitor When SQL Server 2008 Management Studio Starts
In the Tools menu, click Options. In the Options dialog box expand Environment and then select the General tab. In the "At Startup" drop down you need to chose "Open Object Explorer and Activity Monitor" option from the drop down list and click OK. In order to see this change you need to close and reopen SQL Server 2008 Management Studio.
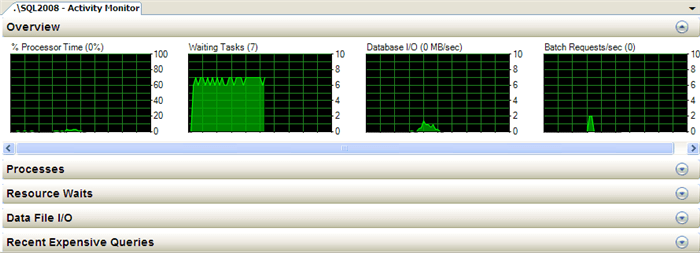
Overview of SQL Server 2008 Activity Monitor
In SQL Server 2008, Activity Monitor is divided into five sections namely Overview, Processes, Resource Waits, Data File I/O and Recent Expensive Queries. We will cover each section in detail.
Overview: - This shows the graphical display of Processor Time (%), Number of Waiting Tasks, Database I/O (MB/Sec) and the Number of Batch Requests/second.
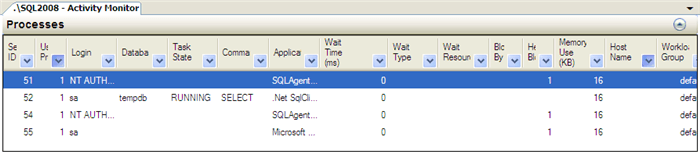
Processes: - This shows the list of all the active users which are connected to SQL Server Database Engine. Here, you can right click any of the Session IDs which you think are problematic and can run a SQL Server Profiler Trace to capture all its activities; you can also see the Session Details or can even KILL a process.
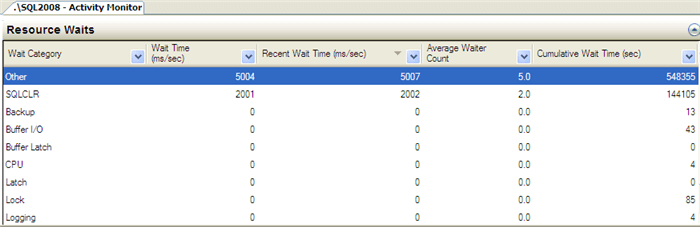
Resource Waits: - This provides valuable information with respect to a thread which is waiting for a key resource such as Memory, CPU and Network etc on an instance of SQL Server. This helps database administrators indentify potential bottlenecks with respect to Memory, CPU, Network I/O etc.
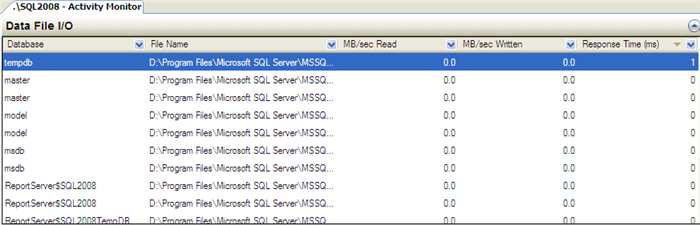
Data File I/O: - This displays disk level I/O information related to all the data and log files of user and system databases. Database administrators can quickly identify databases which are performing badly due to disk bottlenecks.
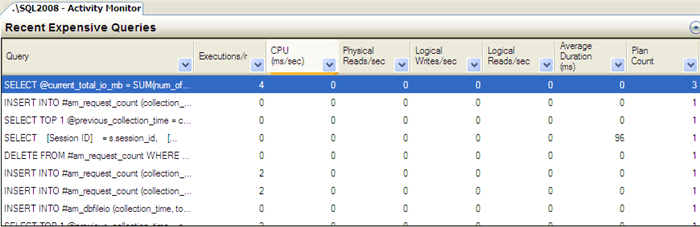
Recent Expensive Queries: - In this section, database administrators can quickly identify poorly performing queries in an SQL Server Instance. With the feature, which I like the most, you can right click any of the problematic queries and choose the "Edit Query Text" option to edit the query. Moreover, you can also see the execution plan of the poorly performing query by right clicking the problematic query and by selecting the option "Show Execution Plan".
Next Steps
- Take the time to review these new tools in SQL Server 2008
- Read these other tips related to SQL Server 2008
- Identify SQL Server 2008 Performance Issues using
最新文章
- 限制Xamarin获取图片的大小
- Shuffling Machine和双向链表
- Unity3d《Shader篇》法线贴图
- [译]line clampin让文字在指定的行数内省略号显示
- Apache+tomcat+mod_jk+centos6.2负载均衡集群配置--转载
- MATLAB学习笔记(五)——MATLAB绘图
- golang编码转换
- TopFreeTheme精选免费模板【20130619】
- 删除链表中全部值为k的节点
- C# - 定义集合,索引符
- tcmalloc资料
- haproxy之配置文件解析
- 用户权限模块之oauth2.0
- 51nod_1714:B君的游戏(博弈 sg打表)
- python time、datetime、random、os、sys模块
- cocos2d JS 源生js实现each方法
- Mybatis的SqlSession运行原理
- zabbix监控nginx连接数量
- GC垃圾收集器分类
- AutoMapper在MVC中的运用02-Decimal转String、集合、子父类映射