matplotlib基本使用(矩形图、饼图、热力图、3D图)
2024-08-29 00:11:06
使用matplotlib画简单的图形:
#-*- coding:utf-8 -*-

from numpy.random import randn

import matplotlib.pyplot as plt

fig=plt.figure()

ax1=fig.add_subplot(2,2,1)

plt.plot(randn(50).cumsum(),'k--')

ax2=fig.add_subplot(2,2,2)

#bins越大矩形越窄 alpha表示颜色深度

ax2.hist(randn(10000), bins  = 30, color = 'red', alpha = 1)

ax3=fig.add_subplot(2,2,3)

plt.plot([1.5, 2, 4, -2, 1.6])

plt.show()
运行结果:

散点图
#-*- coding:utf-8 -*-

from pylab import *

import matplotlib.pyplot as plt

mpl.rcParams['font.sans-serif'] = ['SimHei']

n = 1024

X = np.random.normal(0,1,n)

Y = np.random.normal(0,1,n)

for i in range(1,10):

    scatter(i, i)

plt.title(u"散点图",color='red')

show()

pyplot.subplots有几个选项
nrows:subplot的行数
ncols:subplot的列数
sharex:所有subplot共享x轴刻度
sharey:所有subplot共享Y轴刻度
#-*- coding:utf-8 -*-

from  numpy.random import randn

from matplotlib import pyplot as plt

fig,axes=plt.subplots(2,2,sharex=True,sharey=True)

for i in range(2):

    for j in range(2):

        axes[i,j].hist(randn(50),bins=50,color='red',alpha=1)

plt.show()

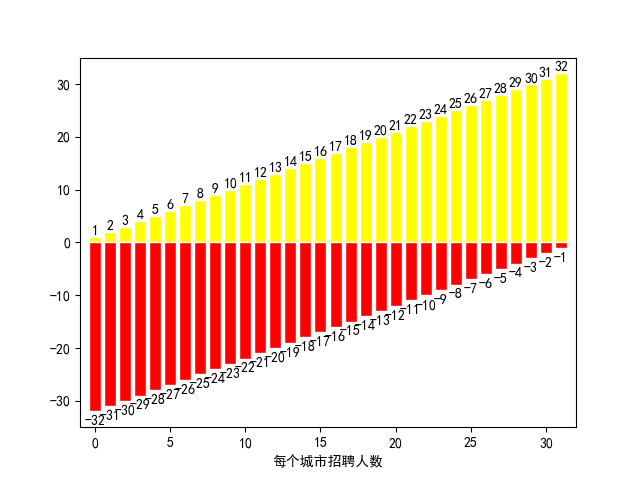
矩阵图
#-*- coding:utf-8 -*-

from pylab import *

#使用中文

mpl.rcParams['font.sans-serif'] = ['SimHei']

#显示负号

matplotlib.rcParams['axes.unicode_minus'] = False

n=32

list1=[i for i in range(1,33)]

list2=[i for i in range(-32,0)]

n= np.arange(n)

xlim(-1,32)

ylim(-35,35)

xlabel(u'每个城市招聘人数')

bar(n, list1, facecolor='yellow', edgecolor='white')

bar(n, list2, facecolor='red', edgecolor='white')

for x,y in zip(n,list1):

    text(x, y, '%d' % y, ha='center', va= 'bottom' )

for x,y in zip(n,list2):

    text(x, y-3, '%d' % y, ha='center', va= 'bottom')

show()
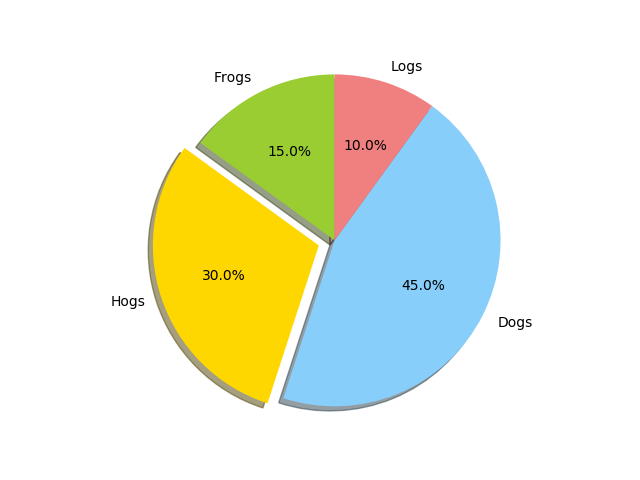
饼图
# -*- coding: utf-8 -*-

import matplotlib.pyplot as plt

labels = 'Frogs', 'Hogs', 'Dogs', 'Logs'  # 设置标签

sizes = [15, 30, 45, 10]  # 占比,和为100

colors = ['yellowgreen', 'gold', 'lightskyblue', 'lightcoral']  # 颜色

explode = (0, 0.1, 0, 0)  # 展开第二个扇形,即Hogs,间距为0.1

plt.pie(sizes, explode=explode, labels=labels, colors=colors, autopct='%1.1f%%', shadow=True,

        startangle=90)  # startangle控制饼状图的旋转方向

plt.axis('equal')  # 保证饼状图是正圆,否则会有一点角度偏斜

plt.show()
# -*- coding: utf-8 -*-

import matplotlib.pyplot as plt

import numpy as np

labels = 'Frogs', 'Hogs', 'Dogs', 'Logs'  # 设置标签

colors = ['yellowgreen', 'gold', 'lightskyblue', 'lightcoral']  # 颜色

explode = (0.1, 0.2, 0, 0)  # 展开第二个扇形,即Hogs,间距为0.1

fig = plt.figure()

ax = fig.gca()

ax.pie(np.random.random(4), explode=explode, labels=labels, colors=colors, autopct='%1.1f%%', shadow=True,

       startangle=90, radius=0.25, center=(0, 0), frame=True)

ax.pie(np.random.random(4), explode=explode, labels=labels, colors=colors, autopct='%1.1f%%', shadow=True,

       startangle=90, radius=0.25, center=(1, 1), frame=True)

ax.pie(np.random.random(4), explode=explode, labels=labels, colors=colors, autopct='%1.1f%%', shadow=True,

       startangle=90, radius=0.25, center=(0, 1), frame=True)

ax.pie(np.random.random(4), explode=explode, labels=labels, colors=colors, autopct='%1.1f%%', shadow=True,

       startangle=90, radius=0.25, center=(1, 0), frame=True)

ax.set_xticks([0, 1])  # 设置位置

ax.set_yticks([0, 1])

ax.set_xticklabels(["Sunny", "Cloudy"])  # 设置标签

ax.set_yticklabels(["Dry", "Rainy"])

ax.set_xlim((-0.5, 1.5))

ax.set_ylim((-0.5, 1.5))

ax.set_aspect('equal')

plt.show()

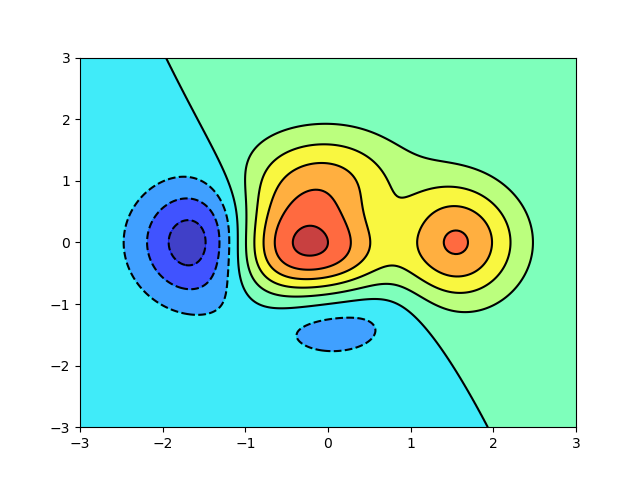
热力图
#-*- coding:utf-8 -*-

from pylab import *

def f(x,y): return (1-x/2+x**5+y**3)*np.exp(-x**2-y**2)

n = 256

x = np.linspace(-3,3,n)

y = np.linspace(-3,3,n)

X,Y = np.meshgrid(x,y)

contourf(X, Y, f(X,Y), 8, alpha=.75, cmap='jet')

C = contour(X, Y, f(X,Y), 8, colors='black', linewidth=.5)

show()
利用numpy来实现sin函数
#-*- coding:utf-8 -*-

from pylab import *

#使用中文

mpl.rcParams['font.sans-serif'] = ['SimHei']

#显示负号

matplotlib.rcParams['axes.unicode_minus'] = False

t=np.arange(0.0,2.0,0.01)#0到2之间,以0.01为间距

s=np.sin(2*np.pi*t)#利用numpy实现2sinπx

plt.plot(t,s)

plt.xlabel('t的值')

plt.ylabel('s的值')

#这里同时可以使用plt.xlim()和plt.ylim()来限制x、y轴的范围

plt.show()

#-*- coding:utf-8 -*-

from pylab import *

#使用中文

mpl.rcParams['font.sans-serif'] = ['SimHei']

#显示负号

matplotlib.rcParams['axes.unicode_minus'] = False

x1=np.linspace(0.0,5.0)

x2=np.linspace(0.0,2.0)

y1=np.cos(2*np.pi*x1)*np.exp(-x1)

y2=np.cos(2*np.pi*x2)

plt.subplot(2,1,1)

plt.plot(x1,y1,'y*-')#y表示颜色,*表示点的样子,-表示连接

plt.title('图1')

plt.subplot(2,1,2)#最后一个2表示在第二个位置

plt.plot(x1,y2,'r.--')

plt.title('图2')

plt.show()

#-*- coding:utf-8 -*-
from pylab import * #使用中文
mpl.rcParams['font.sans-serif'] = ['SimHei']
#显示负号
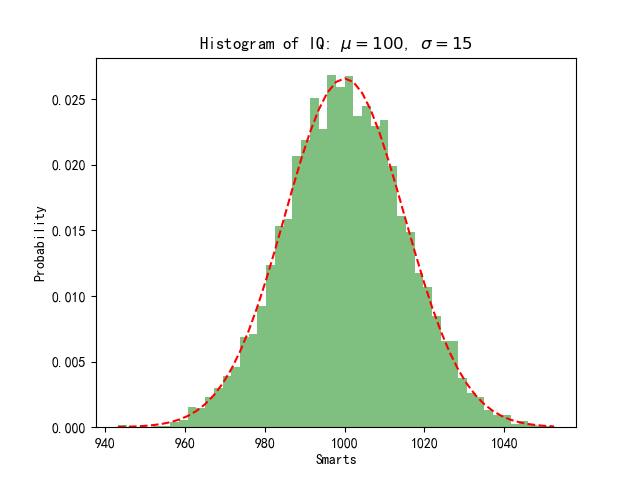
matplotlib.rcParams['axes.unicode_minus'] = False mu=1000
sigma=15
x=mu+sigma*np.random.randn(10000)#在均值周围产生符合正态分布x值 num_bins=50
n,bins,patches=plt.hist(x,num_bins,normed=1,facecolor='green',alpha=0.5)
#直方图函数,x为x轴的值,normed=1表示为概率密度,即和为一,绿色方块,色深参数0.5.返回n个概率,直方块左边线的x值,及各个方块对象
y=mlab.normpdf(bins,mu,sigma)#画一条逼近的曲线
plt.plot(bins,y,'r--')
plt.xlabel('Smarts')
plt.ylabel('Probability')
plt.title(r'Histogram of IQ: $\mu=100$, $\sigma=15$') plt.subplots_adjust(left=0.15)
plt.show()
# -*- coding:utf-8 -*-

from pylab import *

from mpl_toolkits.mplot3d import Axes3D

x_list = [[3, 3, 2], [4, 3, 1], [1, 2, 3], [1, 1, 2], [2, 1, 2]]

fig = plt.figure()

ax = Axes3D(fig)

for x in x_list:

    ax.scatter(x[0], x[1], x[2], c='r')

plt.show()

from pylab import *

from mpl_toolkits.mplot3d import Axes3D

fig = plt.figure()

ax = fig.add_subplot(1, 1, 1, projection='3d')

X = np.arange(1, 10, 1)

Y = np.arange(1, 10, 1)

X, Y = np.meshgrid(X, Y)

Z = 3 * X + 2 * Y + 30

surf = ax.plot_surface(X, Y, Z, rstride=1, cstride=1, cmap=cm.jet, linewidth=0, antialiased=True)

ax.set_zlim3d(0,100)

fig.colorbar(surf, shrink=0.5, aspect=5)

plt.show()

# -*- coding:utf-8 -*-
from mpl_toolkits.mplot3d import Axes3D
from matplotlib import cm
from matplotlib.ticker import LinearLocator, FormatStrFormatter
import matplotlib.pyplot as plt
import numpy as np

fig = plt.figure()
ax = fig.gca(projection='3d')
X = np.arange(-5, 5, 0.1)
Y = np.arange(-5, 5, 0.1)
X, Y = np.meshgrid(X, Y)
R = np.sqrt(X ** 2 + Y ** 2)
Z = np.sin(R)
surf = ax.plot_surface(X, Y, Z, rstride=1, cstride=1, cmap=cm.coolwarm, linewidth=0, antialiased=False)
# 画表面,x,y,z坐标, 横向步长,纵向步长,颜色,线宽,是否渐变
ax.set_zlim(-1.01, 1.01)  # 坐标系的下边界和上边界

ax.zaxis.set_major_locator(LinearLocator(10))  # 设置Z轴标度
ax.zaxis.set_major_formatter(FormatStrFormatter('%.02f'))  # Z轴精度
fig.colorbar(surf, shrink=0.5, aspect=5)  # shrink颜色条伸缩比例(0-1),aspect颜色条宽度(反比例,数值越大宽度越窄)

plt.show()

最新文章
- http://www.mysqltutorial.org/python-mysql-query/
- Android studio 使用Gradle发布Android开源项目到JCenter 总结
- 【转】Python 日期和时间
- 字符串0.在php和js中转换为布尔类型 值是false还是true
- [解决方案] pythonchallenge level 6
- [原]SQL_实验2.1.3 清华大学出版社
- spring关于“transactionAttributes”的相关配置
- 经历:如何设置jquery easyui中下拉框不可编辑
- [jQuery编程挑战]008 生成逗号分隔数字
- Tomcat,Weblogic,WebSphere,JBoss四种服务器简单对比
- Using Apache with SSL1(转载)
- Java面试题之七
- Java的重载和重写差别(面试常见)
- Git复习步骤
- 使用go mod结合docker分层缓存进行自动CI/CD
- API接口设计,rest,soap
- MySQL processlist中需要关注的状态
- 面向对象开发C++快速入门视频教程 C++基础加实战视频教程
- Codeforces 841B - Godsend
- vue生产环境部署总结