数学建模python matlab 编程(随机游走问题)
2024-09-27 16:38:04
1
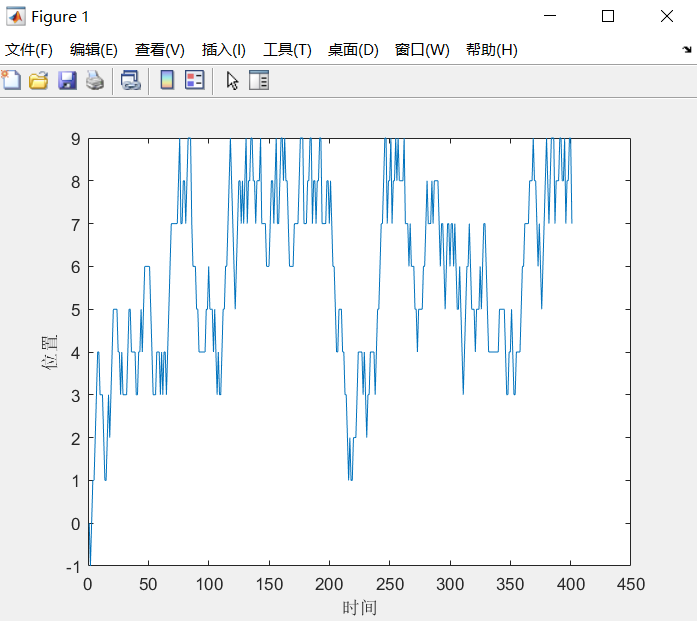
(1). 随机游走问题。在-10到10的一维线段上,质点以1/5的概率用左运动1单位,以2/5的概率停止不动,以2/5的概率向右运动2单位,且碰到-10时向右运动3单位,碰到10时向左运动4单位。请画出它的轨迹。
我原来的代码matlab:
s=0;

now=0;

for i=1:400

    x=unifrnd(0,1);

    if x<=0.2

        if now-1 <= -10

            now=now-1+3;

        else

            now=now-1;

        end

    elseif x>0.6

        if now+1 >= 10

            now =now+1-3;

        else

            now=now+1;

        end

    end

    s = [s now];

end

s

plot(s)

xlabel('时间')

ylabel('位置')
老师的代码:
Ctrl+R 注释
Ctrl+T 取消注释
…… 换行不影响代码完整性
F5运行
clear
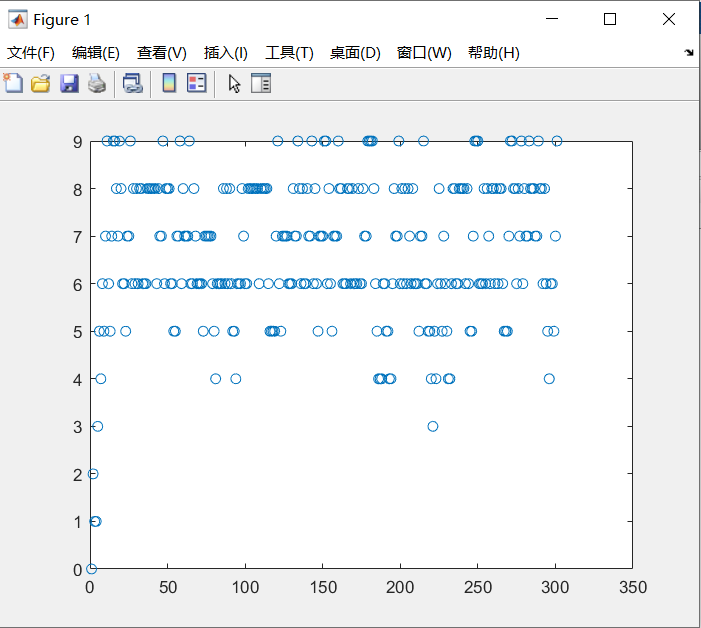
s(1)=0;t=300
for n=1:t
a=rand(1);
s(n+1)=(s(n)-1).*(a<1/5)+s(n).*(a<3/5&a>1/5)+......
(s(n)+2).*(a>3/5)
s(n+1)=-7.*(s(n+1)<=-10)+6.*(s(n+1)>=10)+s(n+1).*(s(n+1)<10&s(n+1)>-10);
end
plot(s,'O')
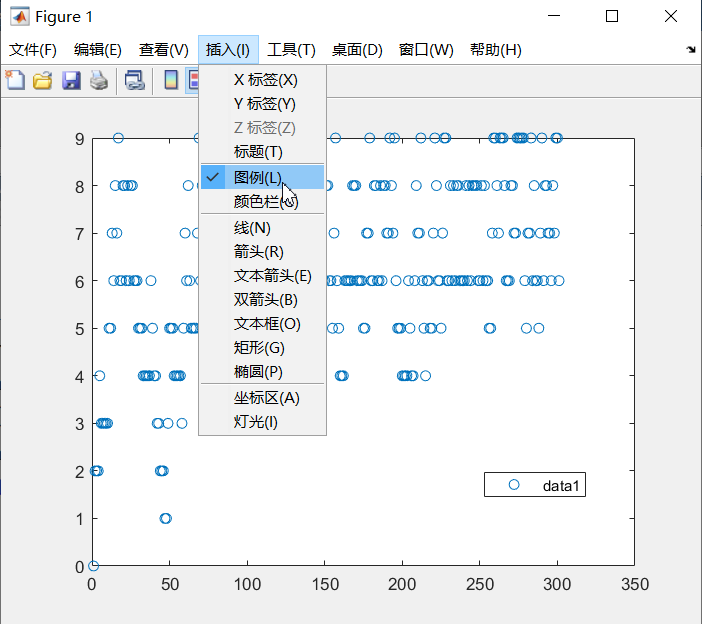
插入图例,标签,标题等
python代码:
import random
import matplotlib.pyplot as plt
s=[0]
for i in range(400):
a = random.random()
s.append((s[-1]-1)*(a<1/5)+s[-1]*(a<3/5 and a>1/5)+(s[-1]+2)*(a>3/5))
s[-1]=-7*(s[-1]<=-10)+6*(s[-1]>=10)+s[-1]*(s[-1]<10 and s[-1]>-10);
#plt.plot(s) fig = plt.figure()
ax = fig.add_subplot(1,1,1)
x = range(len(s))
#plt.scatter(y,s, marker='o')
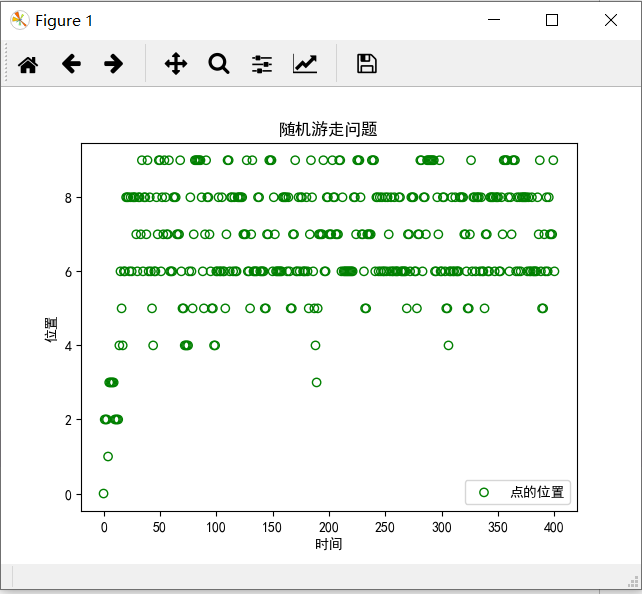
ax.scatter(x,s,color='', marker='o', edgecolors='g',label='点的位置') #颜色为空,设置为空 #解决中文显示问题
plt.rcParams['font.sans-serif']=['SimHei']
plt.rcParams['axes.unicode_minus'] = False # 设置标题
ax.set_title('随机游走问题')
# 设置横坐标名称
ax.set_xlabel('时间')
# 设置纵坐标名称
ax.set_ylabel('位置') # 添加图例
#ax.legend(loc="upper left")
ax.legend(loc="") #自动选择一个空的位置
fig.show()
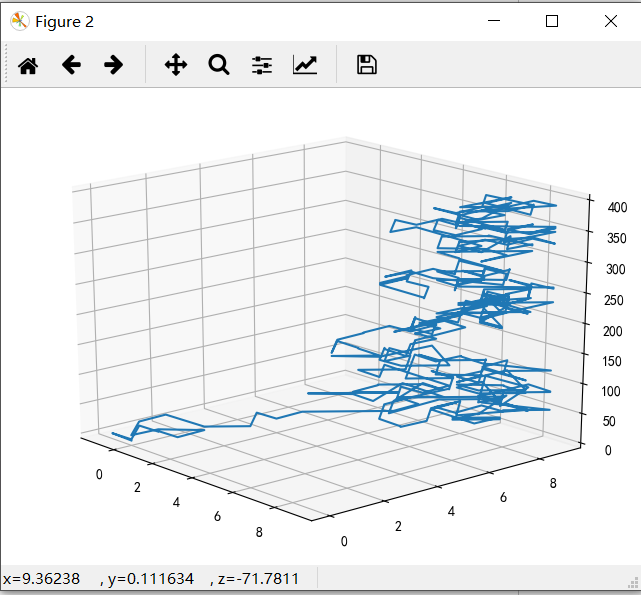
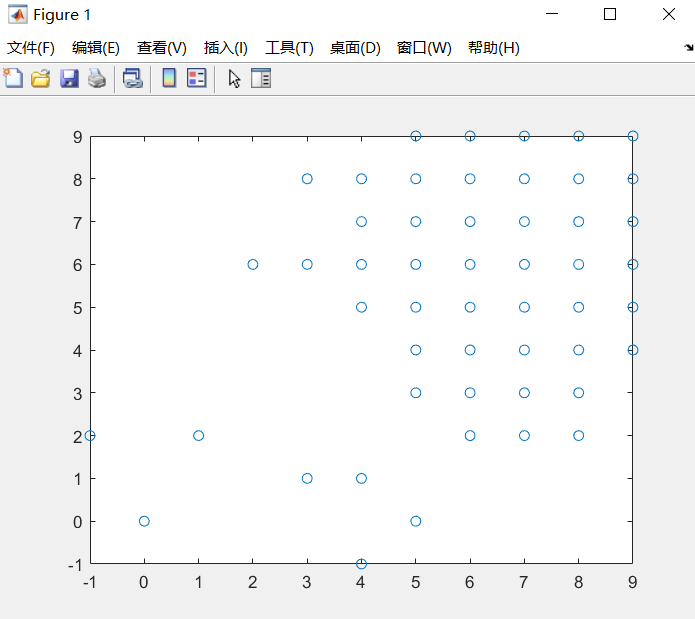
(2)考虑二维空间的布朗运动。
画图时加上横坐标和纵坐标说明,且考虑如何将图片插入到word文档中去。
考虑如何将图片中加上一横线和一纵线。
我的python代码:
import random

import matplotlib.pyplot as plt

from mpl_toolkits.mplot3d.axes3d import Axes3D

s=[0]

sy=[0]

for i in range(400):

    x = random.random()

    if x<=0.2:

        if s[-1]-1 <= -10:

            s.append(s[-1]-1+3)

        else:

            s.append(s[-1]-1)

    elif x>0.2 and x<=0.6:

        s.append(s[-1])

    elif x>0.6:

        if s[-1]+1 >= 10:

            s.append(s[-1]+1-3)

        else:

            s.append(s[-1]+1)

    x = random.random()

    if x<=0.2:

        if sy[-1]-1 <= -10:

            sy.append(sy[-1]-1+3)

        else:

            sy.append(sy[-1]-1)

    elif x>0.2 and x<=0.6:

        sy.append(sy[-1])

    elif x>0.6:

        if sy[-1]+1 >= 10:

            sy.append(sy[-1]+1-3)

        else:

            sy.append(sy[-1]+1)

fig = plt.figure()

ax = fig.add_subplot(1,2,1)

ax.plot(s)

ax.set_ylabel('时间',color='r')

ax.set_xlabel('位置',color='c')

ay = fig.add_subplot(1,2,2)

ay.plot(sy)

ay.set_ylabel('时间',color='r')

ay.set_xlabel('位置',color='c')

fig.show()

# 此处fig是二维

fig = plt.figure()

# 将二维转化为三维

axes3d = Axes3D(fig)

# axes3d.scatter3D(x,y,z)

# 效果相同

z=range(401)

axes3d.plot(s,sy,z)
我的matlab代码:
clear

s(1)=0;t=500

y(1)=0;

for n=1:t

    a=rand(1);

    s(n+1)=(s(n)-1).*(a<1/5)+s(n).*(a<3/5&a>1/5)+(s(n)+2).*(a>3/5)

    s(n+1)=-7.*(s(n+1)<=-10)+6.*(s(n+1)>=10)+s(n+1).*(s(n+1)<10&s(n+1)>-10);

    a=rand(1);

    y(n+1)=(y(n)-1).*(a<1/5)+y(n).*(a<3/5&a>1/5)+(y(n)+2).*(a>3/5)

    y(n+1)=-7.*(y(n+1)<=-10)+6.*(y(n+1)>=10)+y(n+1).*(y(n+1)<10&y(n+1)>-10);

end

plot(s,y,'O')
最新文章
- python基础回顾1
- C# 里的if/switch
- gdo图形引擎中的旋转角
- android 常用小功能(第二版)
- [LeetCode]题解(python):036-Valid Sudoku
- AVFoundation的使用
- centos 服务器配置(三) 之定时任务
- POJ 2492 A Bug's Life (并查集)
- Nagios3完整配置文档
- 【甘道夫】HBase连接池 -- HTablePool是Deprecated之后
- docker开发实践
- CSS中的px与物理像素、逻辑像素、1px边框问题
- Python基础知识2-内置数据结构(下)
- docker部署maven私有仓库 nexus3
- 7 selenium 模块
- oracle查询重复的数据
- js的相关函数封装(正则表达式,获取url参数,时间格式化)
- Redmine 删除 project 中的 public 选项
- 学界 | Yann LeCun新作,中日韩文本分类到底要用哪种编码?
- 深入理解C/C++二维数组