tensorflow读书笔记
TensorFlow 是一个用于研究和生产的开放源代码机器学习库。TensorFlow 提供了各种 API,可供初学者和专家在桌面、移动、网络和云端环境下进行开发。
TensorFlow是采用数据流图(data flow graphs)来计算,所以首先我们得创建一个数据流流图,然后再将我们的数据(数据以张量(tensor)的形式存在)放在数据流图中计算. 节点(Nodes)在图中表示数学操作,图中的边(edges)则表示在节点间相互联系的多维数据数组, 即张量(tensor)。训练模型时tensor会不断的从数据流图中的一个节点flow到另一节点, 这就是TensorFlow名字的由来。
TensorFlowd的特性:
1.灵活性
2.可移植性
3.多语言支持
4.高效性
Graph:要组装的结构,由许多操作组成,其中的每个连接点代表一种操作
op:接受(流入)零个或多个输入(液体),返回(流出)零个或多个输出
张量是tensorflow中的基本数据结构,张量有很多种,TensorFlow用张量这种数据结构来表示所有的数据.你可以把一个张量想象成一个n维的数组或列表.一个张量有一个静态类型和动态类型的维数.张量可以在图中的节点之间流通.其实张量更代表的就是一种多位数组。在tensorflow中,有很多操作张量的函数,有生成张量、创建随机张量、张量类型与形状变换和张量的切片与运算。
张量从流图的一端流动到另一端的计算过程。它生动形象地描述了复杂数据结构在人工神经网中的流动、传输、分析和处理模式
tensorflow程序应用统计:
import tensorflow as tf
from tensorflow import keras
# Helper libraries
import numpy as np
import matplotlib.pyplot as plt
print(tf.__version__)
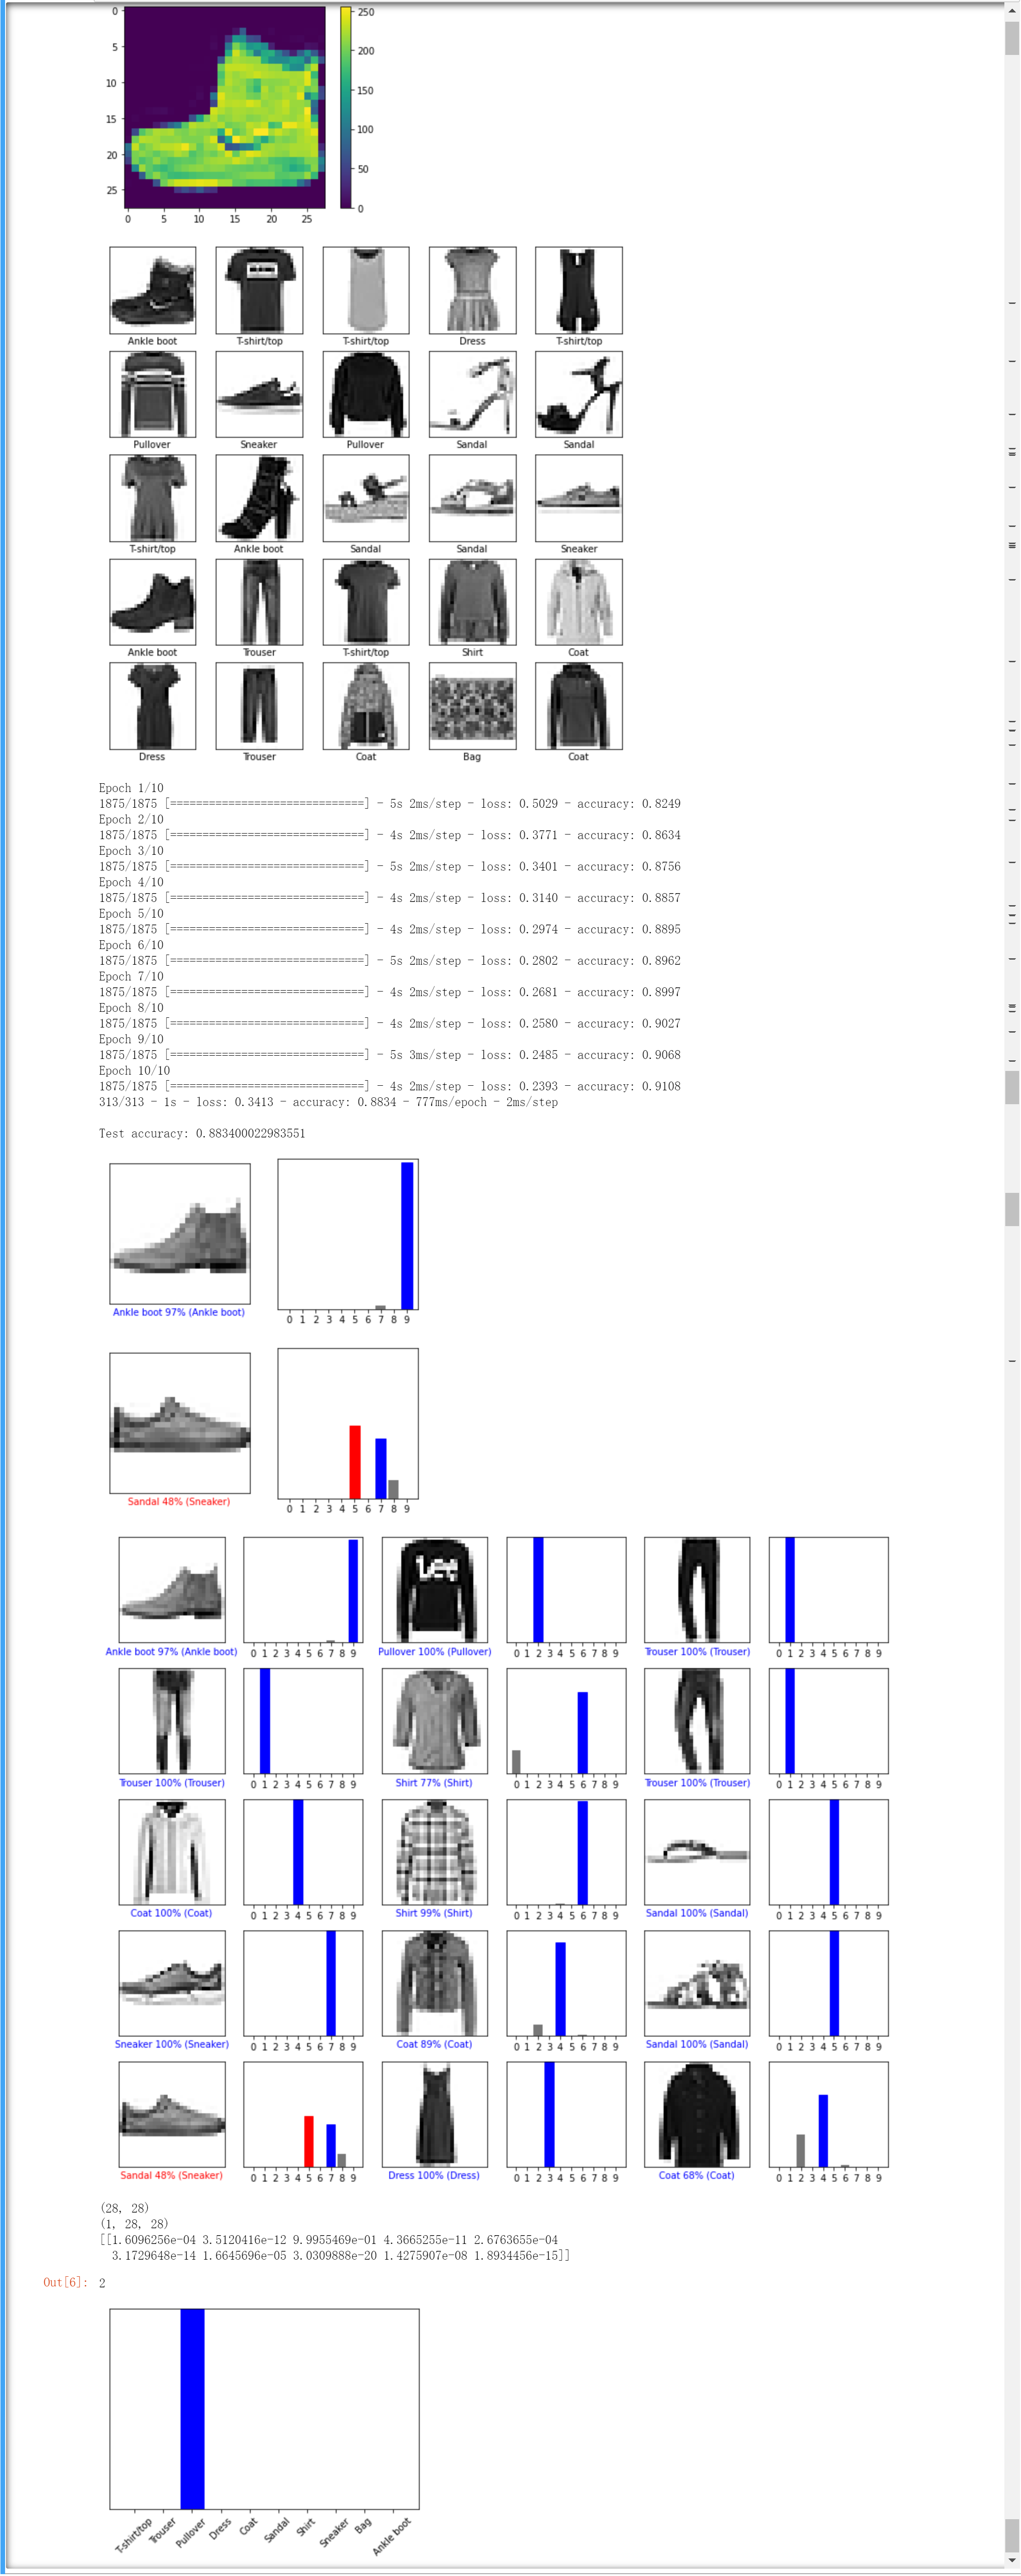
fashion_mnist = keras.datasets.fashion_mnist
(train_images, train_labels), (test_images, test_labels) = fashion_mnist.load_data()
fashion_mnist = keras.datasets.fashion_mnist
class_names = ['T-shirt/top', 'Trouser', 'Pullover', 'Dress', 'Coat',
'Sandal', 'Shirt', 'Sneaker', 'Bag', 'Ankle boot']
len(train_labels)
len(test_labels)
plt.figure()
plt.imshow(train_images[0])
plt.colorbar()
plt.grid(False)
plt.show()
train_images = train_images / 255.0
test_images = test_images / 255.0
plt.figure(figsize=(10,10))
for i in range(25):
plt.subplot(5,5,i+1)
plt.xticks([])
plt.yticks([])
plt.grid(False)
plt.imshow(train_images[i], cmap=plt.cm.binary)
plt.xlabel(class_names[train_labels[i]])
plt.show()
model = keras.Sequential([
keras.layers.Flatten(input_shape=(28, 28)),
keras.layers.Dense(128, activation='relu'),
keras.layers.Dense(10)
])
model.compile(optimizer='adam',
loss=tf.keras.losses.SparseCategoricalCrossentropy(from_logits=True),
metrics=['accuracy'])
model.fit(train_images, train_labels, epochs=10)
test_loss, test_acc = model.evaluate(test_images, test_labels, verbose=2)
print('\nTest accuracy:', test_acc)
probability_model = tf.keras.Sequential([model,
tf.keras.layers.Softmax()])
predictions = probability_model.predict(test_images)
np.argmax(predictions[0])
def plot_image(i, predictions_array, true_label, img):
predictions_array, true_label, img = predictions_array, true_label[i], img[i]
plt.grid(False)
plt.xticks([])
plt.yticks([])
plt.imshow(img, cmap=plt.cm.binary)
predicted_label = np.argmax(predictions_array)
if predicted_label == true_label:
color = 'blue'
else:
color = 'red'
plt.xlabel("{} {:2.0f}% ({})".format(class_names[predicted_label],
100*np.max(predictions_array),
class_names[true_label]),
color=color)
def plot_value_array(i, predictions_array, true_label):
predictions_array, true_label = predictions_array, true_label[i]
plt.grid(False)
plt.xticks(range(10))
plt.yticks([])
thisplot = plt.bar(range(10), predictions_array, color="#777777")
plt.ylim([0, 1])
predicted_label = np.argmax(predictions_array)
thisplot[predicted_label].set_color('red')
thisplot[true_label].set_color('blue')
i = 0
plt.figure(figsize=(6, 3))
plt.subplot(1, 2, 1)
plot_image(i, predictions[i], test_labels, test_images)
plt.subplot(1, 2, 2)
plot_value_array(i, predictions[i], test_labels)
plt.show()
i = 12
plt.figure(figsize=(6, 3))
plt.subplot(1, 2, 1)
plot_image(i, predictions[i], test_labels, test_images)
plt.subplot(1, 2, 2)
plot_value_array(i, predictions[i], test_labels)
plt.show()
# Plot the first X test images, their predicted labels, and the true labels.
# Color correct predictions in blue and incorrect predictions in red.
num_rows = 5
num_cols = 3
num_images = num_rows * num_cols
plt.figure(figsize=(2 * 2 * num_cols, 2 * num_rows))
for i in range(num_images):
plt.subplot(num_rows, 2 * num_cols, 2 * i + 1)
plot_image(i, predictions[i], test_labels, test_images)
plt.subplot(num_rows, 2 * num_cols, 2 * i + 2)
plot_value_array(i, predictions[i], test_labels)
plt.tight_layout()
plt.show()
# Grab an image from the test dataset.
img = test_images[1]
print(img.shape)
# Add the image to a batch where it's the only member.
img = (np.expand_dims(img, 0))
print(img.shape)
predictions_single = probability_model.predict(img)
print(predictions_single)
plot_value_array(1, predictions_single[0], test_labels)
_ = plt.xticks(range(10), class_names, rotation=45)
np.argmax(predictions_single[0])
最新文章
- Mint Linux 安装 DotnetCore 遭遇无法修正错误,因为您要求某些软件包保持现状,就是它们破坏了软件包间的依赖关系
- 字典转换成NSString(NSJson)
- Oracle报 ORA-00054资源正忙的解决办法
- php的Excel相关操作
- 变废为宝,将Discuz废弃的cache机制引入到memory体系中
- 2014-08-07 SSDB 使用 rocksdb 引擎
- 用 .htaccess 实现网址规范化
- Creating InetAddress object in Java
- Difference Between Primes
- ZOJ1610_Count the Colors(段树/为段更新)
- JAVA多线程--Thinking in java
- ES6中函数新增的方式方法
- Java爬虫_资源网站爬取实战
- java位移运算符2 转
- CentOS7(64) yum安装、配置PostgreSQL 11
- 实际操作--create DB link
- xxx.jar或者xxx.war中没有主清单属性和spring-boot-maven-plugin的作用
- 几种流行Webservice框架
- SDL2.0 VLC ubuntu安装和黑屏问题
- Activiti工作流引擎简介