matlab中wvtool
参考:https://ww2.mathworks.cn/help/signal/ref/wvtool.html?searchHighlight=wvtool&s_tid=doc_srchtitle
wvtool 工具可以同时查看时域和频域图
wvtool
Open Window Visualization Tool
Syntax
wvtool(WindowVector)
wvtool(WindowVector1,...,WindowVectorN)
 H = wvtool(...)
Description
wvtool( opens the Window Visualization Tool (WVTool) with time and frequency domain plots of the window vector specified in WindowVector)WindowVector. WindowVector must be a real-valued row or column vector. By default, the frequency domain plot is the magnitude squared of the Fourier transform of the window vector in decibels (dB). You can generate window vectors for a number of common window functions using the Signal Processing Toolbox software. See window for a list of supported window functions.
wvtool( opens WVTool with time and frequency domain plots of the window vectors specified in WindowVector1,...,WindowVectorN)WindowVector1, …, WindowVectorN.
H = wvtool(...) returns the figure handle, H.
Note
A related tool, Window Designer, is available for designing and analyzing windows.

Note
If you launch WVTool from Filter Designer, an Add/Replace icon, which controls how new windows are added from Filter Designer, appears on the toolbar.
WVTool Menus
In addition to the usual menus items, wvtool contains these wvtool-specific menu commands:
File menu:
Export — Exports the displayed plot(s) to a graphic file.
Edit menu:
Copy figure — Copies the displayed plot(s) to the clipboard (available only on Windows platforms).
Copy options — Displays the Preferences dialog box (available only on Windows platforms).
Figure, Axes, and Current Object Properties — Displays the Property Editor.
View menu:
Time domain — Check to show the time domain plot.
Frequency domain — Check to show the frequency domain plot.
Legend — Toggles the window name legend on and off. This option is also available with the Legend toolbar button.
Analysis Parameters — Controls the response plot parameters, including number of points, range, x- and y-axis units, sampling frequency, and normalized magnitude.
You can also access the Analysis Parameters by right-clicking the x-axis label of a plot in the Window Viewer panel.
Insert menu:
You use the Insert menu to add labels, titles, arrows, lines, text, and axes to your plots.
Tools menu:
Edit Plot — Turns on plot editing mode
Zoom In — Zooms in along both x- and y-axes.
Zoom X — Zooms in along the x-axis only. Drag the mouse in the x direction to select the zoom area.
Zoom Y — Zooms in along the y-axis only. Drag the mouse in the y direction to select the zoom area.
Full View — Returns to full view.
Examples
Display and Compare Windows
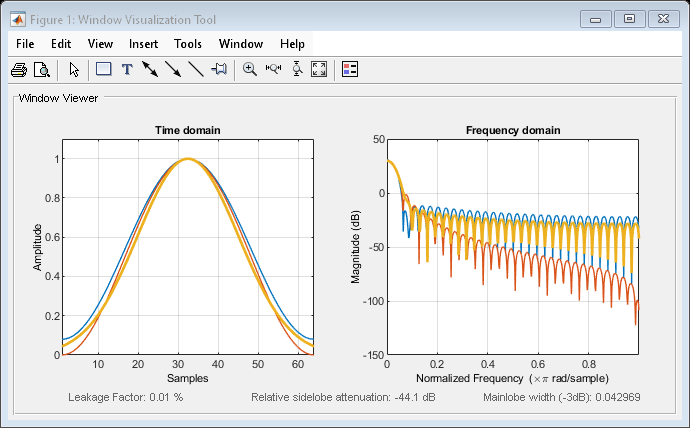
Use wvtool to display and compare 64-point Hamming, Hann, and Gaussian windows.
wvtool(hamming(64),hann(64),gausswin(64))
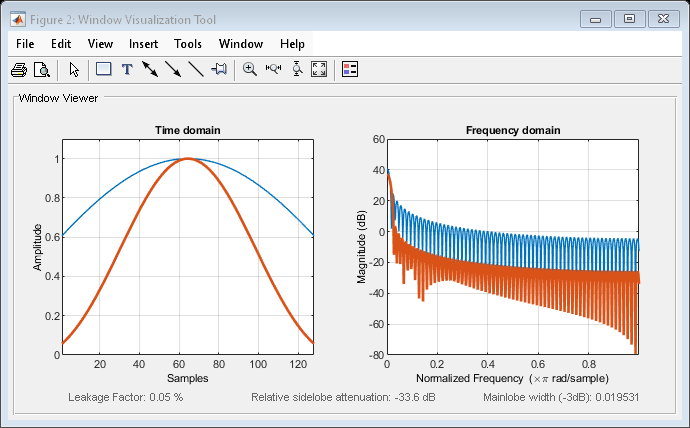
Compare 128-point Kaiser windows with different values of β.
wvtool(kaiser(128,1.5),kaiser(128,4.5))
最新文章
- webservices接口 file "/axis2-web/listsingleservice.jsp" not found 问题解决
- XMl各种格式转换功能代码
- centos7安装出现license information(license not accepted)解决办法
- perl 入门的基础
- AndroidUI优化工具——HierarchyViewer
- C#强力粉碎文件代码分享,升级中用到
- javascript之享元模式
- Event Functions
- Microsoft Visual Studio 2013如何设置查找头文件的路径
- zoj2729 Sum Up(模拟)
- Python 第七篇:socket编程
- Sublime Text3 + Golang搭建开发环境
- jq中的evet.target
- centos设置网卡开机自启动
- 了解UI Automator Viewer
- 错误:Could not find a getter for CreatTime in class
- Apache-Flink深度解析-SQL概览
- 阿里云人脸识别测试接口出错 返回Body:{ "errno": 3002, "err_msg": "ILLEGAL_PARAMETERS", "request_id": "672cba83-cf93-4ef4-9ce5-d87e51601632" }
- Codeforces Round #495 (Div. 2) C. Sonya and Robots
- 修改sqlserver2008数据库的排序规则 (转)