perf + Flame Graph火焰图分析程序性能
1、perf命令简要介绍
性能调优时,我们通常需要分析查找到程序百分比高的热点代码片段,这便需要使用 perf record 记录单个函数级别的统计信息,并使用 perf report 来显示统计结果;
usage: perf [--version] [--help] [OPTIONS] COMMAND [ARGS]

 The most commonly used perf commands are:

   annotate        Read perf.data (created by perf record) and display annotated code

   archive         Create archive with object files with build-ids found in perf.data file

   bench           General framework for benchmark suites

   buildid-cache   Manage build-id cache.

   buildid-list    List the buildids in a perf.data file

   data            Data file related processing

   diff            Read perf.data files and display the differential profile

   evlist          List the event names in a perf.data file

   inject          Filter to augment the events stream with additional information

   kmem            Tool to trace/measure kernel memory properties

   kvm             Tool to trace/measure kvm guest os

   list            List all symbolic event types

   lock            Analyze lock events

   mem             Profile memory accesses

   record          Run a command and record its profile into perf.data

   report          Read perf.data (created by perf record) and display the profile

   sched           Tool to trace/measure scheduler properties (latencies)

   script          Read perf.data (created by perf record) and display trace output

   stat            Run a command and gather performance counter statistics

   test            Runs sanity tests.

   timechart       Tool to visualize total system behavior during a workload

   top             System profiling tool.

   trace           strace inspired tool

   probe           Define new dynamic tracepoints

 See 'perf help COMMAND' for more information on a specific command.
举例
perf record -e cpu-clock -g -p 222
-g 选项是告诉perf record额外记录函数的调用关系
-e cpu-clock 指perf record监控的指标为cpu周期
-p 指定需要record的进程pid
程序运行完之后,perf record会生成一个名为perf.data的文件,如果之前已有,那么之前的perf.data文件会被覆盖
获得这个perf.data文件之后,就需要perf report工具进行查看
perf report -i perf.data
-i 指定要查看的文件
以诊断fluentd为例,report结果:
$perf report -i perf.data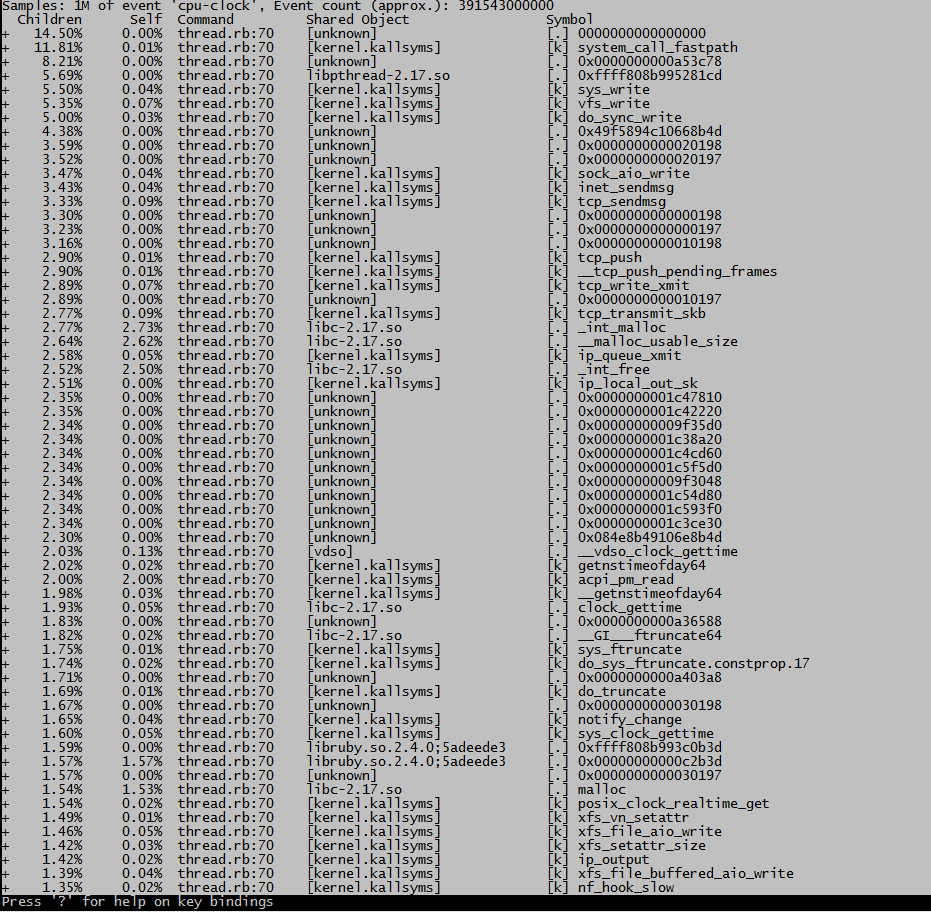
这种格式很不直观
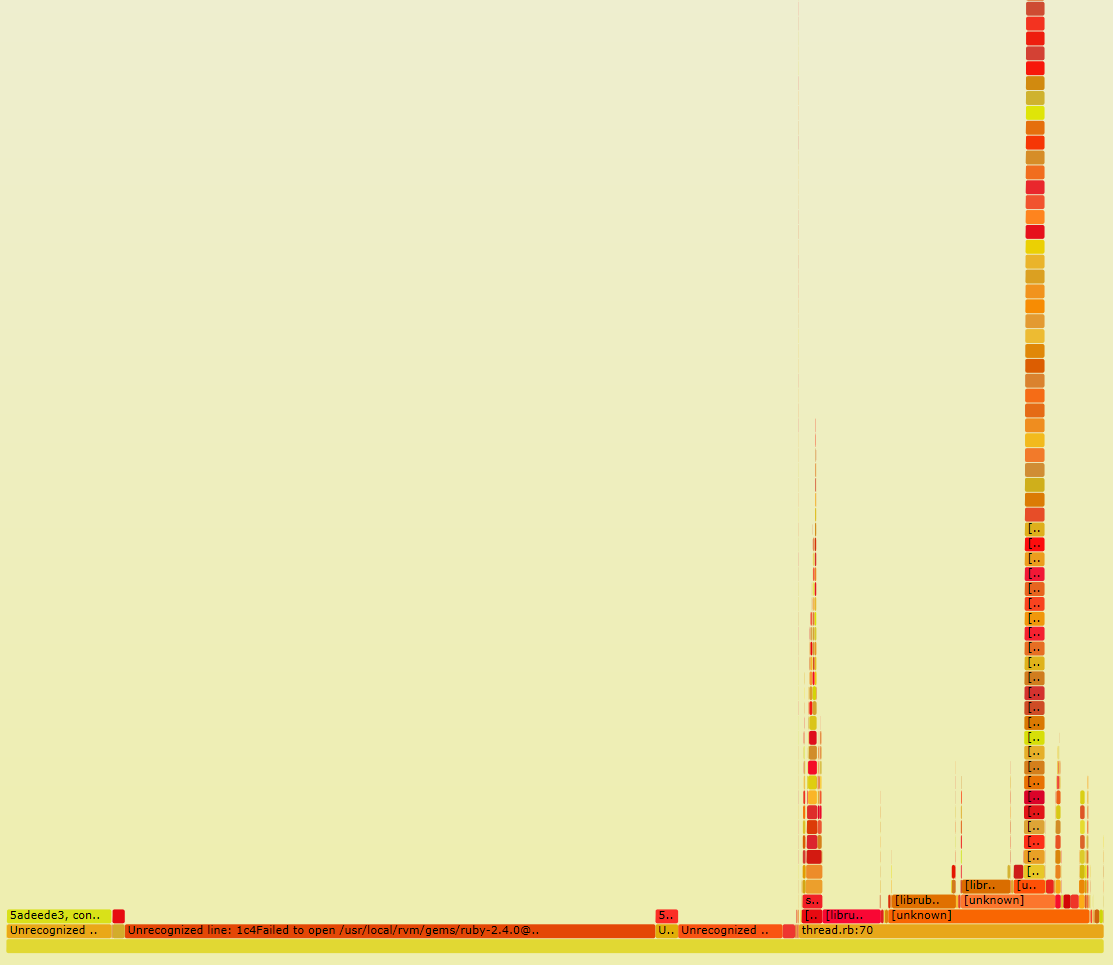
2、使用火焰图展示结果
1、Flame Graph项目位于GitHub上:https://github.com/brendangregg/FlameGraph
2、可以用git将其clone下来:git clone https://github.com/brendangregg/FlameGraph.git
注意:git clone之后,下面用到的*.pl文件先给+x可执行权限,注意路径
我们以perf为例,看一下flamegraph的使用方法:
1、第一步
$perf record -e cpu-clock -g -p 28591
Ctrl+c结束执行后,在当前目录下会生成采样数据perf.data.
2、第二步
用perf script工具对perf.data进行解析
perf script -i perf.data &> perf.unfold
3、第三步
将perf.unfold中的符号进行折叠:
./stackcollapse-perf.pl perf.unfold &> perf.folded
注意:该命令可能有错误,错误提示在perf.folded
4、最后生成svg图:
./flamegraph.pl perf.folded > perf.svg
最新文章
- Github+Jekyll —— 创建个人免费博客(一)从零开始
- [HTML/HTML5]3 页面结构
- javascript 小技巧
- python中subprocess.Popen.poll
- Linux 下Shell 脚本几种基本命令替换区别
- objective-c 下面int 和 NSData数据 互相转换的方法
- 部署lvs-rrd监控LVS
- cocos2dx中的其他层
- springboot 热部署的两种方式
- spark Transformations算子
- mysql 按类别之用一条SQL语句查询出每个班前10名学生数据
- servlet请求中的信息
- Qt5文件操作_保存成"UTF-8"格式
- python里面如何拷贝一个对象,deecopy和copy的区别
- OpenGL ES3 非常好的系列文章
- linux服务器管理员的12个有用的命令
- Wpf中显示Unicode字符
- 爬虫常用库之pyquery 库
- PHP+JQUERY+AJAX上传、裁剪图片
- busdog is a filter driver for MS Windows (XP and above) to sniff USB traffic.