【VSA】One-shot video-based person re-identification with variance subsampling algorithm
导言
针对现有工作中存在的错误伪标签问题,文章通过优化样本间的相似性度量和伪标签置信度评估策略来改善这个问题,从而提供模型性能。具体地,文章提出了方差置信度的概念,并设计了方差二次采样算法将方差置信度和距离置信度结合起来作为采样准则,同时还提出了方差衰减策略来更好了优化选择出来的伪标签样本。最终,该方法将MARS数据集上的mAP和Rank1分别提高了 3.94%和4.55%。
引用
@article{DBLP:journals/jvca/ZhaoYYHYZ20,
author = {Jing Zhao and
Wenjing Yang and
Mingliang Yang and
Wanrong Huang and
Qiong Yang and
Hongguang Zhang},
title = {One-shot video-based person re-identification with variance subsampling
algorithm},
journal = {Comput. Animat. Virtual Worlds},
volume = {31},
number = {4-5},
year = {2020}
}
相关链接
原文链接:https://onlinelibrary.wiley.com/doi/10.1002/cav.1964
或者下方↓公众号后台回复“VSA”,即可获得论文电子资源。

解决了什么问题
Previous works propose the distance-based sampling for unlabeled datapoints to address the few-shot person re-identification task, however, many selected samples may be assigned with wrong labels due to poor feature quality in these works, which negatively affects the learning procedure.
主要贡献和创新点
- We propose the variance confidence to measure the credibility of pseudo-labels, which can be widely used as a general similarity measurement.
- We propose a novel VSA(variance subsampling algorithm) to improve the accuracy of pseudo-labels for selected samples. It combines distance confidence and variance confidence as the sampling criterion, and adopt a variance decay strategy as the sampling strategy.
创新点主要有三个:
- 一是提出了方差置信度(variance confidence)的概念
- 二是提出了VSA(方差二次采样算法)
- 三是提出了方差衰减策略(variance decay strategy)。
基本框架
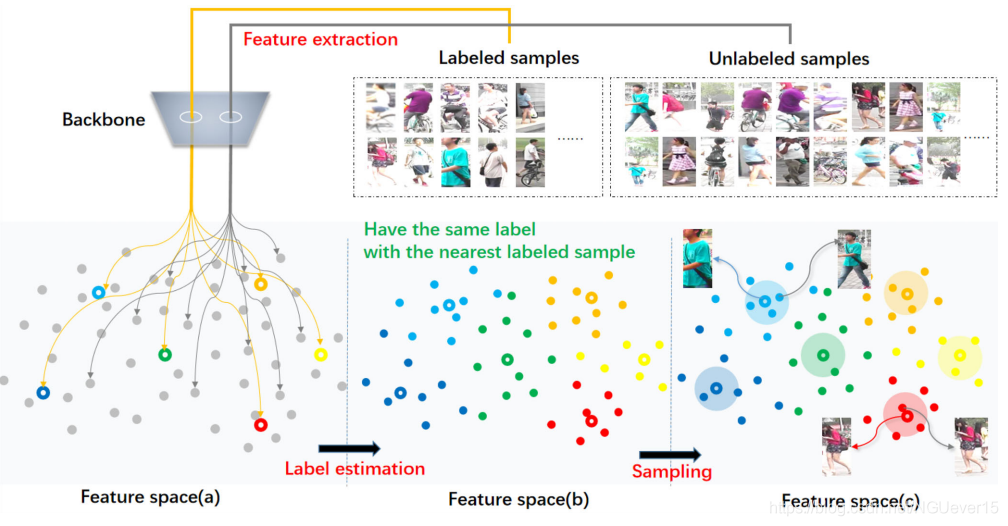
The dataset extension process. Both labeled and unlabeled samples are extracted into the feature space through the backbone network in step 1. As shown in feature space (a), the gray points indicate unlabeled samples, and the colored hollow points indicate labeled samples. Different colors indicate different person identity. Then label estimation is performed according to the criterion that the unlabeled sample has the same label as the nearest labeled sample in step 2. We call the sample after label estimation a pseudo-label sample, which is the colored solid point in the feature space (b). Finally, the pseudo-label samples with higher confidence are preferred, which are closer to the labeled samples in feature space (c)
整体框架采用监督训练和数据扩展交叉迭代进行的模式。数据扩展的过程如上图所示,具体包括了特征提取、标签估计和伪标签样本采样三个环节。
提出的方法
01 variance confidence方差置信度
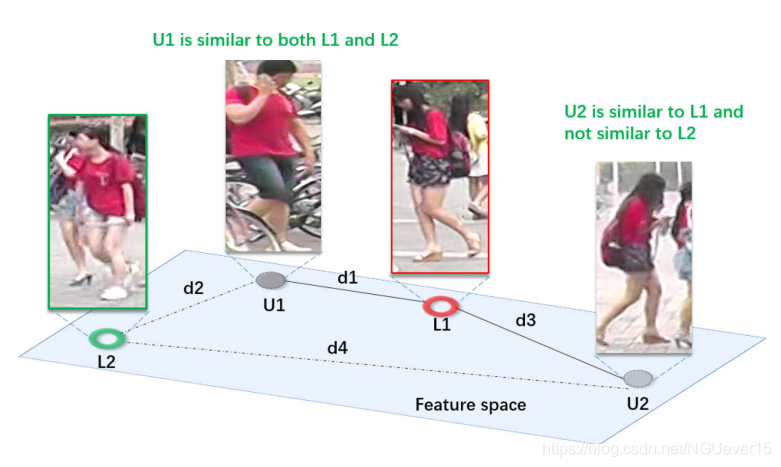
A distribution situation in the feature space. U1 and U2 represent two unlabeled samples, and L1 and L2 are the two labeled samples with the closest distance to both U1 and U2 in the feature space. di,i∈[1,4], represent the Euclidean distance between samples and satisfy Equation (7). The solid line represents the distance between the unlabeled sample and its nearest labeled sample. While U1 is similar to L1, it is also similar to L2 with the same extent. On the contrary, although U2 is slightly similar to L1, it is very different from L2. Therefore, it is more believable that U2 is more likely than U1 to fall into the same category as L1
作者举例了特征空间中的一种分布情况。 U1和U2是无标注样本,L1和L2是距离U1和U2最近的带标注样本。di表示样本之间的欧几里得距离,且满足\(d_1<d_2<d_3<d_4\)。 如果仅根据距离来度量样本标签的可靠性的话,那U1优于U2(因为d1<d3)。 但作者认为,当一个样本(U1)同时和两个不同的样本(L1和L2)相似的时候(d1和d2相差很小),那这个样本就谁都不像了。
作者用无标签样本与其距离最近的两个带标注样本的距离方差来表示方差置信度,且方差越大,置信度越高。
02 Variance Subsampling Algorithm 方差二次采样算法
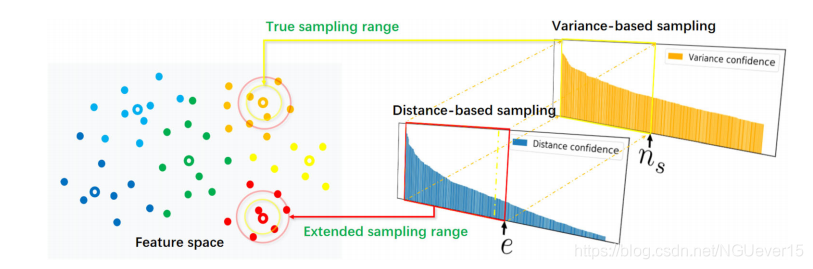
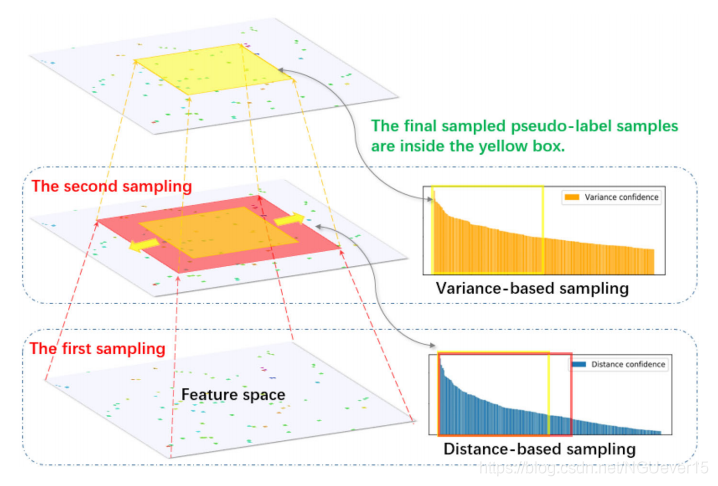
The sampling criterion of variance subsampling algorithm. Hollow points in the feature space represent labeled samples, and solid points represent pseudo-label samples. The first sampling is based on the distance confidence. The number of sampling is extended to e, corresponding to the range of the red squares and circles in the figure. The second sampling is based on the variance confidence, and the number of samples is restored to ns, which corresponds to the range of the yellow box and the circle in the figure.
作者通过二次采样的形式,将距离置信度和方差置信度结合了起来,作为采样准则。
03 Variance decay strategy 方差衰减策略
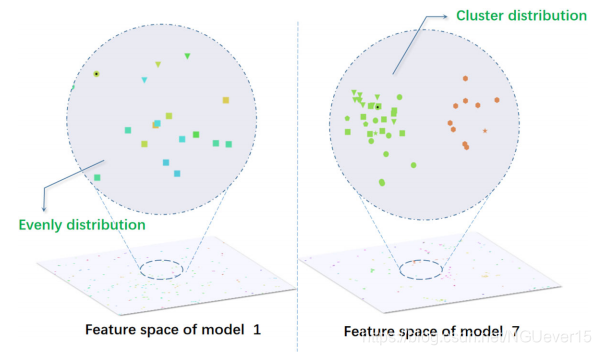
The partial distribution of the real feature space. Colors is used to distinguish different people identity, and shapes is used to distinguish the camera. Black dots in the center of the sample indicate that this is the original labeled sample. The distribution in the first iteration is relatively uniform, while the distribution after the seventh iteration has shown a clustering distribution。
作者在实验过程中可视化了特征空间的真实分布情况。 发现模型训练到中后期时,提取出的特征空间已经呈现出了聚类分布。
Obviously, in the case of the feature distribution of model 7 in Figure 5, the situation described in Figure 3 will hardly occur. This shows that the situation described in Figure 3 is gradually reduced during the iteration process. Therefore, a variance decay strategy is proposed as the sampling strategy. A stopping factor
最新文章
- Linux2.6.11版本:classic RCU的实现
- Eclipse 调试技巧
- php进程的SIGBUS故障
- POJ——3984
- struts2+Hibernate4+spring3+EasyUI环境搭建之二:搭建spring
- Linux下ln链接命令详解
- Android Device Chooser中显示Target unknown解决方法
- RAC和单节点数据库的区别有哪些?RAC最有用的功能是什么?
- 通用HttpClientUtil工具类
- javaScript判断手机型号
- Vim使用技巧:常用光标跳转命令
- Mac上安装Charles进行抓包全流程设置
- SoapUI简介及下载地址
- 细说REST API安全之防止重放攻击
- canvas - 简单画板
- 四:(之六_镜像发布)Dockerfile语法梳理和实践
- handoop安装部署集群
- Java技术----Java泛型详解
- 符号arg含义
- ASP.NET WebAPI 测试文档 (Swagger)