使用PyQtGraph绘制图形(2)
2024-09-02 11:06:20
采用addplot()方法将多个图形添加到一个窗口。
首先利用numpy模块创建两个随机数组,用来作为图形绘制的数据:
import pyqtgraph as pg

import numpy as np

x = np.random.random(50)

y = np.random.random(10)

z = np.r_[x,y]
def pg_addplot():

	app = pg.QtGui.QApplication([])

	win = pg.GraphicsWindow(title="PyQtGraph Tutorial")

	p1 = win.addPlot(title='x曲线')

	p1.plot(x)

	p2 = win.addPlot(title='y曲线')

	p2.plot(y)

	app.exec_()
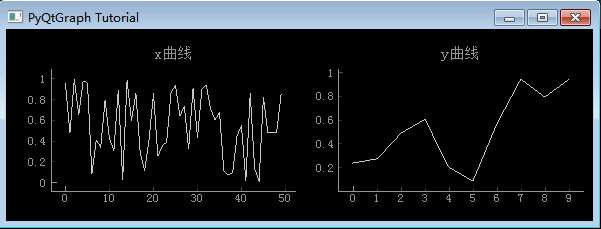
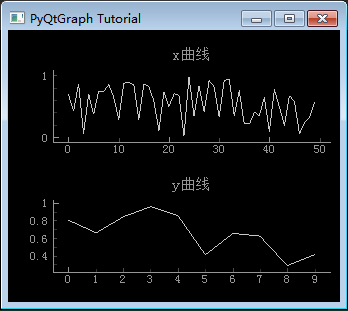
上图为1行2列布置,通过nextRow()更改为2行1列
def pg_addplot():

	app = pg.QtGui.QApplication([])

	win = pg.GraphicsWindow(title="PyQtGraph Tutorial")

	p1 = win.addPlot(title='x曲线')

	p1.plot(x)

        win.nextRow()

	p2 = win.addPlot(title='y曲线')

	p2.plot(y)

	app.exec_()
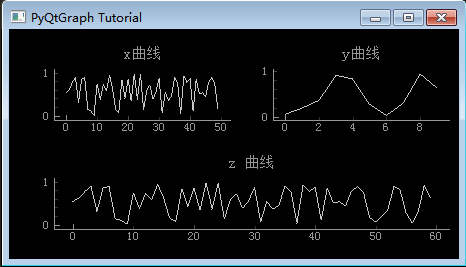
将多个图形放置在一个窗口内,并且占用不同列数
def pg_addplot():

	app = pg.QtGui.QApplication([])

	win = pg.GraphicsWindow(title="PyQtGraph Tutorial")

	p1 = win.addPlot(title='x曲线')

	p1.plot(x)

	p2 = win.addPlot(title='y曲线')

	p2.plot(y)

	win.nextRow()

	p3 = win.addPlot(colspan=2,title='z 曲线')

	p3.plot(z)

	app.exec_()
最新文章
- 适配布局-ios
- ural One-two, One-two 2
- 谈谈patch strategy
- 【codevs1743】 反转卡片
- Ext.MessageBox消息框
- How Tomcat Works(六)
- 去掉 CONSOLE 窗口(转)
- poj 2503 Babelfish (查找 map)
- 排序算法TWO:快速排序QuickSort
- Linux 常见文件打包压缩命令
- jquery hide() show()
- 如何判断网页中引入jquery
- JS面向对象基础
- CF766 E. Mahmoud and a xor trip [预处理][树形dp]
- whereis 命令详解
- [NOI 2011]道路修建
- 《HelloGitHub》第 32 期
- bug管理工具之禅道的测试模块的使用
- nginx r日志中午出现\xE5\x88\x98\xE4\xB8\x96\xE5\xA5\x87
- CMake 常用方法