circso 对数据进行可视化
circos可以用来绘制圈图,能够对染色体上的数据进行可视化,首先需要一个染色体的文件
染色体的文件如下,每列之间空格分隔
chr - chr1    chr1

chr - chr2    chr2

chr - chr3    chr3

chr - chr4    chr4

chr - chr5    chr5

chr - chr6    chr6

chr - chr7    chr7

chr - chr8    chr8

chr - chr9    chr9
第一列 : 表名这行数据是染色体的数据
第二列: -
第三列: 染色体的名称,会显示在图上
第四列: 染色体编号
第五列:染色体的起始位置
第六列: 染色体的终止位置
第七列:染色体的颜色
在circos中有一些默认的颜色设置,用rgb设置一些默认的颜色名, 可以在circos的安装目录的etc/colors.conf 文件中查看,比如chr1 的颜色设置保存在colors.ucsc.conf 中,内容如下
chr1  = ,,

chr2  = ,,

chr3  = ,,

chr4  = ,,

chr5  = ,,

chr6  = ,,

chr7  = ,,

chr8  = ,,

chr9  = ,,

chr10 = ,,

chr11 = ,,

chr12 = ,,

chr13 = ,,

chr14 = ,,

chr15 = ,,

chr16 = ,,

chr17 = ,,

chr18 = ,,

chr19 = ,,

chr20 = ,,

chr21 = ,,

chr22 = ,,

chr23 = ,,

chrX  = ,,

chr24 = ,,

chrY  = ,,

chrM  = ,,

chr0  = ,,

chrUn = ,,

chrNA = ,,
我们也可以自定义一些颜色的名称,将其添加到colors.conf 文件中保存即可,比如自定义颜色
sample1 = ,,
然后就可以使用sample1 作为颜色名了,在circos中还有很多颜色的名字,都是有规律的,比如
vvlred : very very light red
vlred : very light red
lred : light red
red : red
dred : dark red
vdred : very dark red
vvdred : very very dark red
常用的颜色red, green, blue, yellow 都支持上面的颜色定义, 除此之外,还有其他很多的内置颜色, 详细信息可以查看circos安装目录下的/etc/colors.conf 文件查看, 里面的注释部分详细说明了颜色的定义方式。
接下来定义想要展示的数据,这里展示基因在染色体上的区间信息,通过 tile 的方式进行展示
chr1

chr1

chr1

chr1

chr1

chr1

chr1

chr1

chr1

chr1

chr1

chr1

chr1

chr1

chr1

chr1

chr1
第一列: 染色体名称
第二列:基因的起始位置
第三列:基因的终止位置
在下来准备突变位点的信息,用scatter 的方式进行展示
chr1 glyph_size=,fill_color=red
第一列: 染色体名称
第二列: 突变的起始位置
第三列: 突变的终止位置
前三列的数据是必须的,第四列用来设置每个店的大小和颜色
最后是cir<<include colors_fonts_patt<ideogram>
<spacing>

default = 10u

break   = 2u

</spacing>

radius           = .9r

thickness        = 40p

fill             = yes

fill_color       = black

stroke_thickness =

stroke_color     = black

show_label       = yes

label_font       = default

label_radius     = dims(ideogram,radius) + .05r

label_with_tag   = yes

label_size       =

label_parallel   = yes

label_case       = lower

label_format     = eval(sprintf("%s",var(label)))

</ideogram>

<image>

<<include etc/image.conf>>

</image>

karyotype   = monkey_karyotype.txt

chromosomes_units = <plots>

<plot>

type            = tilefile        = genes.txt

r1          = .0r

r0          = .88r

orientation = out

layers      =

margin      = .02u

thickness   =

padding     =

layers_overflow       = hide

stroke_thickness =

stroke_color     = blue

color            = blue

</plot>

<plot>

type             = scatter

file             = scatter.txt

stroke_thickness =

glyph            = circle

max   =

min   =

r1    = .8r

r0    = .3r<rules>

<rule>

condition = var(value) <

glyph_size =

</rule>

<rule>

condition  = var(value) >  && var(value) <

glyph_size =

</rule>

<rule>

condition = var(value) >

gplyph_size =

</rule>

</rules>

<backgrounds>

<background>

color     = vvlgrey

y0        =

</background>

</backgrounds>

</plot>

</plots>

<<include etc/housekeeping.conf>>
直接在circos.conf的目录运行circos,就会生成circos.png 和circos.svg;
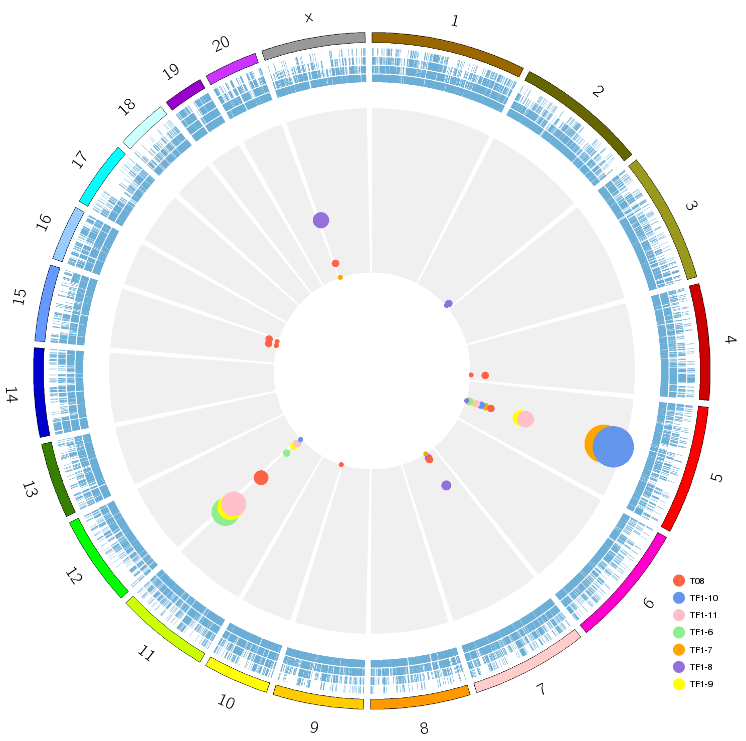
因为circos中没有添加图例的方法,只能手工添加,利用R绘制图列,再用windows自带的画图工具对图片进行剪裁,
最终效果如下:
最新文章
- Codeforces Round #FF(255) DIV2
- Python之迭代器和生成器
- .Net最佳实践3:使用性能计数器收集性能数据
- mysql中的having
- CSS居中完全解决方案
- Ref相关的名词解释
- [MODx] 3. Working with chunks, TV, Category
- Handlebars 介绍
- WCF-IIS-PDA
- lightoj 1079 Just another Robbery
- mfc添加气球式提示栏
- Java 异常归纳总结
- spring mvc:exclude-mapping错误提示
- 201521123062《Java程序设计》第12周学习总结
- yum 安装 nfs,rpcbind 出现错误 libc.so.6(GLIBC_2.14)(64bit) is needed by
- SpringBoot进阶教程(二十二)集成RabbitMQ---MQ实战演练
- 前端开发-1React-1概述
- Centos6两个镜像文件的合并方法
- luogu P3243 [HNOI2015]菜肴制作
- rsyncd的配置和使用