《DSP using MATLAB》Problem 8.10
2024-09-04 03:57:05
代码:
%% ------------------------------------------------------------------------
%% Output Info about this m-file
fprintf('\n***********************************************************\n');
fprintf(' <DSP using MATLAB> Problem 8.10 \n\n');
banner();
%% ------------------------------------------------------------------------ %a0 = 0.90;
%a0 = 0.95;
a0 = 0.99;
% digital iir 1st-order allpass filter
b = [a0 1];
a = [1 a0]; figure('NumberTitle', 'off', 'Name', 'Problem 8.10 Pole-Zero Plot')
set(gcf,'Color','white');
zplane(b,a);
title(sprintf('Pole-Zero Plot, r=%.2f',a0));
%pzplotz(b,a); [db, mag, pha, grd, w] = freqz_m(b, a); % ---------------------------------------------------------------------
% Choose the gain parameter of the filter, maximum gain is equal to 1
% ---------------------------------------------------------------------
gain1=max(mag) % with poles
K = 1
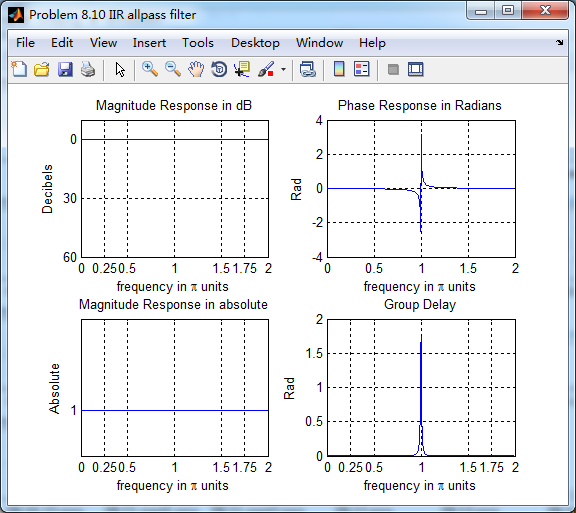
[db, mag, pha, grd, w] = freqz_m(K*b, a); figure('NumberTitle', 'off', 'Name', 'Problem 8.10 IIR allpass filter')
set(gcf,'Color','white'); subplot(2,2,1); plot(w/pi, db); grid on; axis([0 2 -60 10]);
set(gca,'YTickMode','manual','YTick',[-60,-30,0])
set(gca,'YTickLabelMode','manual','YTickLabel',['60';'30';' 0']);
set(gca,'XTickMode','manual','XTick',[0,0.25,0.5,1,1.5,1.75,2]);
xlabel('frequency in \pi units'); ylabel('Decibels'); title('Magnitude Response in dB'); subplot(2,2,3); plot(w/pi, mag); grid on; %axis([0 1 -100 10]);
xlabel('frequency in \pi units'); ylabel('Absolute'); title('Magnitude Response in absolute');
set(gca,'XTickMode','manual','XTick',[0,0.25,0.5,1,1.5,1.75,2]);
set(gca,'YTickMode','manual','YTick',[0,1.0]); subplot(2,2,2); plot(w/pi, pha); grid on; %axis([0 1 -100 10]);
xlabel('frequency in \pi units'); ylabel('Rad'); title('Phase Response in Radians'); subplot(2,2,4); plot(w/pi, grd*pi/180); grid on; %axis([0 1 -100 10]);
xlabel('frequency in \pi units'); ylabel('Rad'); title('Group Delay');
set(gca,'XTickMode','manual','XTick',[0,0.25,0.5,1,1.5,1.75,2]);
%set(gca,'YTickMode','manual','YTick',[0,1.0]); figure('NumberTitle', 'off', 'Name', 'Problem 8.10 IIR allpass filter')
set(gcf,'Color','white');
plot(w/pi, -pha/w); grid on; %axis([0 1 -100 10]);
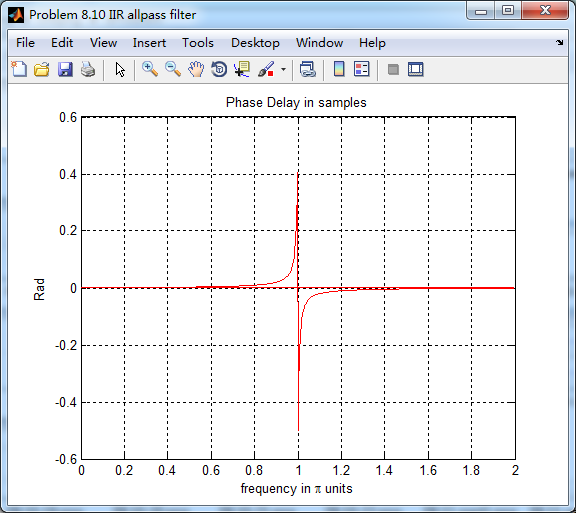
xlabel('frequency in \pi units'); ylabel('Rad'); title('Phase Delay in samples'); % Impulse Response
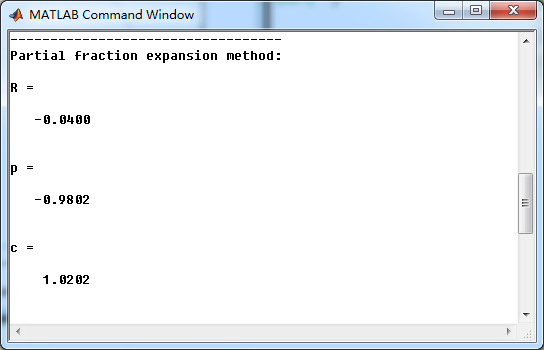
fprintf('\n----------------------------------');
fprintf('\nPartial fraction expansion method: \n');
[R, p, c] = residuez(K*b,a)
MR = (abs(R))' % Residue Magnitude
AR = (angle(R))'/pi % Residue angles in pi units
Mp = (abs(p))' % pole Magnitude
Ap = (angle(p))'/pi % pole angles in pi units
[delta, n] = impseq(0,0,50);
h_chk = filter(K*b,a,delta); % check sequences % ------------------------------------------------------------------------------------------------
% gain parameter K
% ------------------------------------------------------------------------------------------------
%h = -0.2111 * ((-0.9) .^ n) + 1.1111 * delta; %r=0.90
%h = -0.1026 * ((-0.95) .^ n) + 1.0526 * delta; %r=0.95
h = -0.0201 * ((-0.99) .^ n) + 1.0101 * delta; %r=0.99
% ------------------------------------------------------------------------------------------------ figure('NumberTitle', 'off', 'Name', 'Problem 8.10 IIR allpass filter, h(n) by filter and Inv-Z ')
set(gcf,'Color','white'); subplot(2,1,1); stem(n, h_chk); grid on; %axis([0 2 -60 10]);
xlabel('n'); ylabel('h\_chk'); title('Impulse Response sequences by filter'); subplot(2,1,2); stem(n, h); grid on; %axis([0 1 -100 10]);
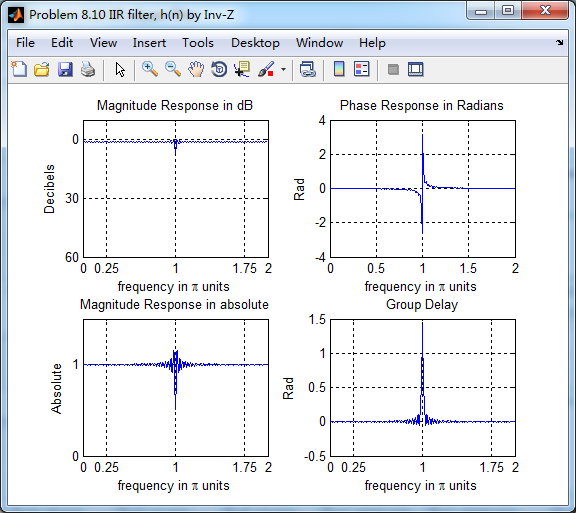
xlabel('n'); ylabel('h'); title('Impulse Response sequences by Inv-Z'); [db, mag, pha, grd, w] = freqz_m(h, 1); figure('NumberTitle', 'off', 'Name', 'Problem 8.10 IIR filter, h(n) by Inv-Z ')
set(gcf,'Color','white'); subplot(2,2,1); plot(w/pi, db); grid on; axis([0 2 -60 10]);
set(gca,'YTickMode','manual','YTick',[-60,-30,0])
set(gca,'YTickLabelMode','manual','YTickLabel',['60';'30';' 0']);
set(gca,'XTickMode','manual','XTick',[0,0.25,1,1.75,2]);
xlabel('frequency in \pi units'); ylabel('Decibels'); title('Magnitude Response in dB'); subplot(2,2,3); plot(w/pi, mag); grid on; %axis([0 1 -100 10]);
xlabel('frequency in \pi units'); ylabel('Absolute'); title('Magnitude Response in absolute');
set(gca,'XTickMode','manual','XTick',[0,0.25,1,1.75,2]);
set(gca,'YTickMode','manual','YTick',[0,1.0]); subplot(2,2,2); plot(w/pi, pha); grid on; %axis([0 1 -100 10]);
xlabel('frequency in \pi units'); ylabel('Rad'); title('Phase Response in Radians'); subplot(2,2,4); plot(w/pi, grd*pi/180); grid on; %axis([0 1 -100 10]);
xlabel('frequency in \pi units'); ylabel('Rad'); title('Group Delay');
set(gca,'XTickMode','manual','XTick',[0,0.25,1,1.75,2]);
%set(gca,'YTickMode','manual','YTick',[0,1.0]);
运行结果:
第1、2小题的图这里不放了。
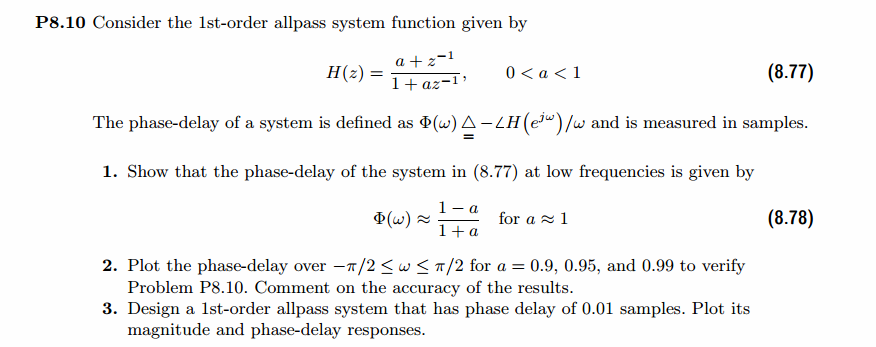
相位延迟phase-delay为0.01时对应的a 的值0.9802
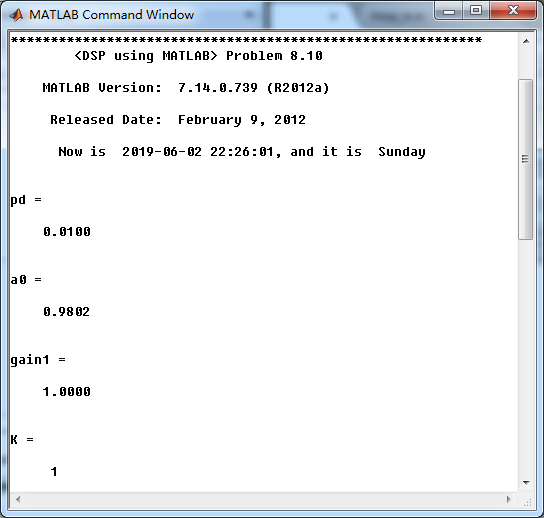
此时1阶全通系统的留数、极点为
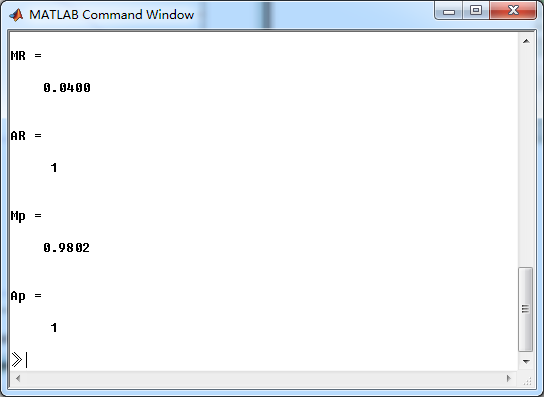
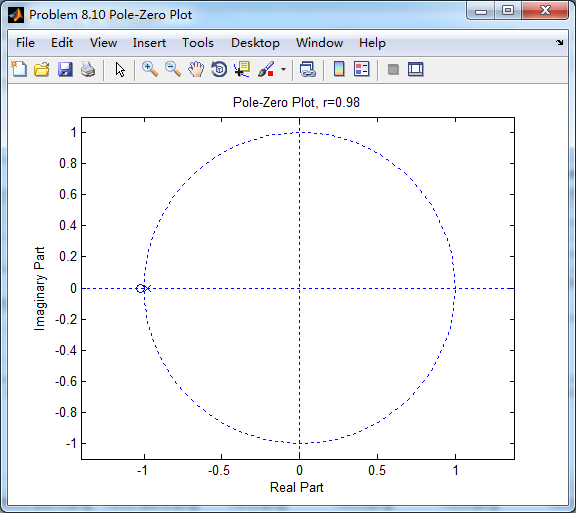
系统零极点图
该系统部分分式展开后,求逆z变换得脉冲响应
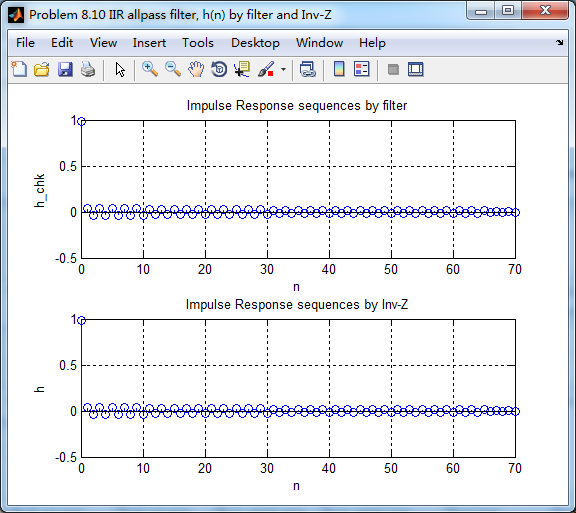
由下图知,两种方法得到的系统脉冲响应h的幅度谱、相位谱、群延迟大致类似(ω=π时不同)。
最新文章
- nyoj_299_Matrix Power Series_矩阵快速幂
- 这些 Git 技能够你用一年了
- java 调用bash shell脚本阻塞的小问题的解决
- mysql delete from
- GetTickCount() 函数的作用和用法
- asp.net中的<%%>形式的详细用法实例讲解
- R语言中的if-else语句写法
- python_Tornado_web_框架_分页
- GET请求和POST请求的区别
- ●POJ 1259 The Picnic
- django url 反响解析,视图
- Ansys热应力计算
- Zookeeper笔记(二)Paxos算法与Zookeeper的工作原理
- 推箱子 HDU1254 (bfs)
- luoguP4643 阿狸和桃子的挑战 思维
- 10-多写一个@Autowired导致程序崩了
- 【招聘123】Some good open positions
- False Ordering LightOJ - 1109(暴力。。唉,。又是一个水题。。)
- react 中使用 lodash 中的 _.throttle
- window10 下 php7.0 添加Sqlserver扩展