一款免费监控aix与Linux的软件--nmon
性能介绍
nmon 工具可以为 AIX 和 Linux 性能专家提供监视和分析性能数据的功能,其中包括:
- CPU 使用率
- 内存使用情况
- 内核统计信息和运行队列信息
- 磁盘 I/O 速度、传输和读/写比率
- 文件系统中的可用空间
- 磁盘适配器
- 网络 I/O 速度、传输和读/写比率
- 页面空间和页面速度
- CPU 和 AIX 规范
- 消耗资源最多的进程
- IBM HTTP Web 缓存
- 用户自定义的磁盘组
- 计算机详细信息和资源
- 异步 I/O,仅适用于 AIX
- 工作负载管理器 (WLM),仅适用于 AIX
- IBM TotalStorage® Enterprise Storage Server® (ESS) 磁盘,仅适用于 AIX
- 网络文件系统 (NFS)
- 动态 LPAR (DLPAR) 更改,仅适用于面向 AIX 或 Linux 的 pSeries p5 和 OpenPower
还包括一个用来从 nmon 的输出生成图形并创建可以在 Web 站点显示的 .gif文件的新工具。
工具运行
安装
- 将 nmonXXX.tar.Z 文件复制到计算机。如果使用 FTP,请记住使用二进制模式。注意:示例中的 XXX 由实际的版本代替。
- 要解压该文件,可以运行 uncompress nmonXX.tar.Z。
- 要提取该文件,可以运行 tar xvf nmonXX.tar。
- 阅读自述文件。
- 要启动 nmon 工具,输入 nmon。
- 如果您是 root 用户,可能需要输入 ./nmon。
下面介绍下安装工具步骤,其实安装还是挺方便挺简单的
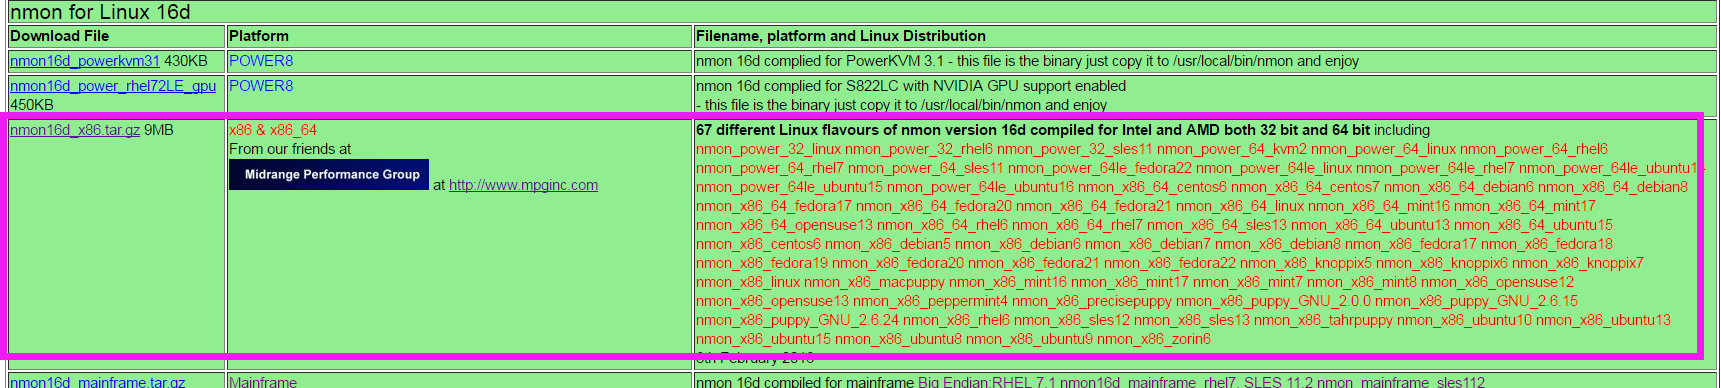
[root@lamw /home/lam7/nmon]# ls

nmon16d_x86.tar.gz nmon_analyser_v51_2.zip
将下载的 nmon16d_x86.tar.gz 解压
[root@lamw /home/lam7/nmon]# tar -xzvf nmon16d_x86.tar.gz
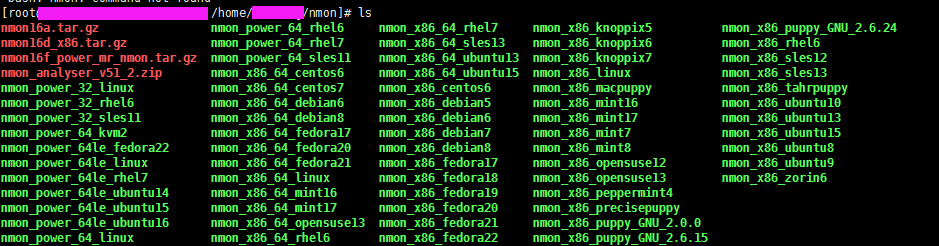
然后会到解压出来好多类型不同平台的二进制nmon,笔者这里的系统是nmon_x86_64_centos6,所以给nmon_x86_64_centos6文件执行权限
找到对应的linux版本
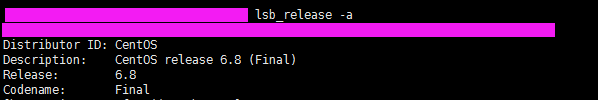
不知道版本的可以输入
[root@lamw /root]# lsb_release -a 查看版本
[root@lamw /home/lam7/nmon]# chmod u+x nmon_x86_64_centos6
笔者这边把 nmon_x86_64_centos6 文件名称改成“nmon”了方便后续执行 (PS:如果不改文件名称可以直接 ./nmon_x86_64_centos6去执行)
然后就可以用 ./nmon去执行了
[root@lamw /home/lam7/nmon]# ./nmon
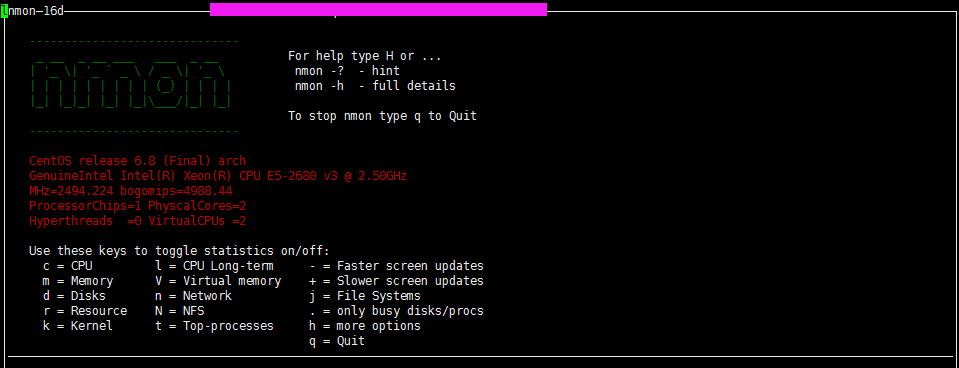
nmon是个交互式程序,当我们执行nmon的时候会出现一个交互窗口,我们执行相关的命令就会出现相关的信息。
比如这里我按c,就会显示cpu的相关信息
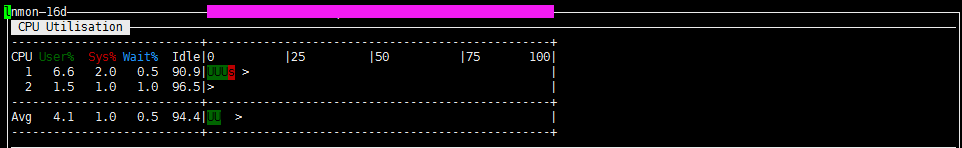
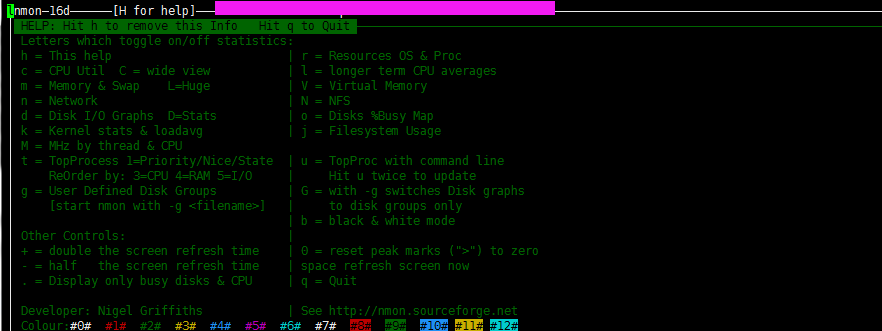
根据自己需要监控的数据直接输入相关信息即可,按H 可以查看对应的命令帮助解释
按q键,退出显示,其实就是这么简单。
下面通过nmon_analyse生成分析报表
nmon -h 可以查看帮助信息

Hint for nmon version 16d

    Full Help Info : nmon -h

    On-screen Stats: nmon

    Data Collection: nmon -f [-s <seconds>] [-c <count>] [-t|-T]

    Capacity Plan  : nmon -x

Interactive-Mode:

    Read the Welcome screen & at any time type: "h" for more help

    Type "q" to exit nmon

For Data-Collect-Mode

    -f            Must be the first option on the line (switches off interactive mode)

                  Saves data to a CSV Spreadsheet format .nmon file in then local directory

                  Note: -f sets a defaults -s300 -c288    which you can then modify

    Further Data Collection Options:

    -s <seconds>  time between data snapshots

    -c <count>    of snapshots before exiting

    -t            Includes Top Processes stats (-T also collects command arguments)

    -x            Capacity Planning=15 min snapshots for 1 day. (nmon -ft -s 900 -c 96)

---- End of Hints

---- Full Help Information for nmon 16d

For Interactive and Data Collection Mode:

    User Defined Disk Groups (DG) - This works in both modes

    It is a work around Linux issues, where disks & partitions are mixed up in /proc files

    & drive driver developers use bizarre device names, making it trick to separate them.

    -g <filename> Use this file to define the groups

                  - On each line: group-name <disks-list>   (space separated list)

                  - Example line: database sdb sdc sdd sde

                  - Up to 64 disk groups, 512 disks per line

                  - Disks names can appear more than one group

    -g auto       - Will generate a file called "auto" with just disks from "lsblk|grep disk" output

     For Interactive use define the groups then type: g or G

     For Data Capture defining the groups switches on data collection

Data-Collect-Mode = spreadsheet format (i.e. comma separated values)

    Note: Use only one of f, F, R, x, X or z to switch on Data Collection mode

    Note: Make it the first argument then use other options to modify the defaults

    Note: Don't collect data that you don't want - it just makes the files too large

    Note: Too many snapshots = too much data and crashes Analyser and other tools

    Note: 500 to 800 snapshots make a good graph on a normal size screen

    Recommended normal minimal options: snapshots every 2 minutes all day:

        Simple capture:      nmon -f  -s 120 -c 720

        With Top Procs:      nmon -fT -s 120 -c 720

        Set the directory:   nmon -fT -s 120 -c 720 -m /home/nag/nmon

        Capture a busy hour: nmon -fT -s   5 -c 720 -m /home/nag/nmon

For Data-Collect-Mode Options

    -f            spreadsheet output format [note: default -s300 -c288]

             output file is <hostname>_YYYYMMDD_HHMM.nmon

    -F <filename> same as -f but user supplied filename

             Not recommended as the default file name is perfect

    The other options in alphabetical order:

    -a            Include Accelerator GPU stats

    -b            Online only: for black and white mode (switch off colour)

    -c <number>   The number of snapshots before nmon stops

    -d <disks>    To set the maximum number of disks [default 256]

                  Ignores disks if the systems has 100's of disk or the config is odd!

    -D            Use with -g to add the Disk Wait/Service Time & in-flight stats

    -f and -F     See above

    -g <filename> User Defined Disk Groups (see above) - Data Capture: Generates  BBBG & DG lines

    -g auto       See above but makes the file "auto" for you of just the disks like sda etc.

    -h            This help output

    -I <percent>  Set the ignore process & disks busy threshold (default 0.1%)

                  Don't save or show proc/disk using less than this percent

    -l <dpl>      Disks per line in data capture to avoid spreadsheet width issues. Default 150. EMC=64.

    -m <directory> nmon changes to this directory before saving to file

                  Useful when starting nmon via cron

    -M         Adds MHz stats for each CPU thread. Some POWER8 model CPU cores can be different frequencies

    -N            Include NFS Network File System for V2, V3 and V4

    -p            nmon outputs the PID when it starts. Useful in scripts to capture the PID for a later safe stop.

    -r <runname>  Use in a benchmark to record the run details for later analysis [default hostname]

    -R          Old rrdtool format used by some - may be removed in the future. If you use this email Nigel

    -s <seconds>  Time between snap shots - with "-c count" decides duration of the data capture

    -t            Include Top Processes in the output

    -T            As -t plus it saves command line arguments in UARG section

    -U            Include the Linux 10 CPU utilisation stats (CPUUTIL lines in the file)

    -V            Print nmon version & exit immediately

    To manually load nmon files into a spreadsheet:

        sort -A *nmon >stats.csv

        Transfer the stats.csv file to your PC

        Start spreadsheet & then Open with type=comma-separated-value ASCII file

        This puts every datum in a different cell

        Now select the data of one type (same 1st column) and graph it

        The nmon Analyser & other tools do not need the file sorted.

Capacity Planning mode - use cron to run each day

    -x            Sensible spreadsheet output for one day

                  Every 15 mins for 1 day ( i.e. -ft -s 900 -c 96)

    -X            Sensible spreadsheet output for busy hour

                  Every 30 secs for 1 hour ( i.e. -ft -s 30 -c 120)

    -z            Like -x but the output saved in /var/perf/tmp assuming root user

Interactive Mode Keys in Alphabetical Order

    Start nmon then type the letters below to switch on & off particular stats

    The stats are always in the same order on-screen

    To see more stats: make the font smaller or use two windows

    Key --- Toggles on off to control what is displayed ---

    b   = Black and white mode (or use -b command line option)

    c   = CPU Utilisation stats with bar graphs (CPU core threads)

    C   = CPU Utilisation as above but concise wide view (up to 192 CPUs)

    d   = Disk I/O Busy% & Graphs of Read and Write KB/s

    D   = Disk I/O Numbers including Transfers, Average Block Size & Peaks (type: 0 to reset)

    g   = User Defined Disk Groups            (assumes -g <file> when starting nmon)

    G   = Change Disk stats (d) to just disks (assumes -g auto   when starting nmon)

    h   = This help information

    j   = File Systems including Journal File Systems

    k   = Kernel stats Run Queue, context-switch, fork, Load Average & Uptime

    l   = Long term Total CPU (over 75 snapshots) via bar graphs

    L   = Large and =Huge memory page stats

    m   = Memory & Swap stats

    M   = MHz for machines with variable frequency 1st=Threads 2nd=Cores 3=Graphs

    n   = Network stats & errors (if no errors it disappears)

    N   = NFS - Network File System

          1st NFS V2 & V3, 2nd=NFS4-Client & 3rd=NFS4-Server

    o   = Disk I/O Map (one character per disk pixels showing how busy it is)

          Particularly good if you have 100's of disks

    q   = Quit

    r   = Resources: Machine type, name, cache details & OS version & Distro + LPAR

    t   = Top Processes: select the data & order 1=Basic, 3=Perf 4=Size 5=I/O=root only

    u   = Top Process with command line details

    U   = CPU utilisation stats - all 10 Linux stats:

          user, user_nice, system, idle, iowait, irq, softirq, steal, guest, guest_nice

    v   = Experimental Verbose mode - tries to make recommendations

    V   = Virtual Memory stats

    Key --- Other Interactive Controls ---

    +   = Double the screen refresh time

    -   = Halves the screen refresh time

    0   = Reset peak counts to zero (peak highlight with ">")

    1   = Top Processes mode 1 Nice, Priority, Status

    3   = Top Processes mode 3 CPU, Memory, Faults

    4   = Top Processes mode 4 as 3 but order by memory

    5   = Top Processes mode 5 as 3 but order by I/O (if root user)

    6   = Highlights 60% row on Long Term CPU view

    7   = Highlights 70% row on Long Term CPU view

    8   = Highlights 80% row on Long Term CPU view

    9   = Highlights 90% row on Long Term CPU view

    .   = Minimum mode i.e. only busy disks and processes shown

    space = Refresh screen now

Interactive Start-up Control

    If you find you always type the same toggles every time you start

    then place them in the NMON shell variable. For example:

     export NMON=cmdrtn

Other items for Interactive and Data Collection mode:

    a) To limit the processes nmon lists (online and to a file)

        either set NMONCMD0 to NMONCMD63 to the program names

        or use -C cmd:cmd:cmd etc. example: -C ksh:vi:syncd

Other items for Data Collection mode:

    b) To you want to stop nmon use: kill -USR2 <nmon-pid>

    c) Use -p and nmon outputs the background process pid

    d) If you want to pipe nmon output to other commands use a FIFO:

        mkfifo /tmp/mypipe

        nmon -F /tmp/mypipe &

        tail -f /tmp/mypipe

    e) If nmon fails please report it with:

       1) nmon version like: 16d

       2) the output of: cd /proc; cat cpuinfo meminfo partitions stat vmstat

       3) some clue of what you were doing

       4) I may ask you to run the debug version or collect data files

    f) If box & line characters are letters then check: terminal emulator & $TERM

    g) External Data Collectors - nmon will execute a command or script at each snapshot time

       They must output to a different file which is merge afterwards with the nmon output

       Set the following shell variables:

        NMON_START  = script to generate CVS Header test line explaining the columns

             Generate: TabName,DataDescription,Column_name_and_units,Column_name_and_units ...

        NMON_SNAP   = script for each snapshots data, the parameter is the T0000 snapshot number

             Generate: TabName,T00NN,Data,Data,Data ...

        NMON_END    = script to clean up or finalise the data

        NMON_ONE_IN = call NMON_START less often (if it is heavy in CPU terms)

        Once capture done: cat nmon-file data-file >merged-file ; ready for Analyser or other tools

        The nmon Analyser will automatically do its best to graph the data on a new Tab sheet

    Developer: Nigel Griffiths     See http://nmon.sourceforge.net

    Feedback welcome - On the current release only

    No warranty given or implied. Copyright GPLv3
运行带 -f 标志的 nmon 命令。
nmon -f -s 30 -c 100
[root@lamw /home/lam7/nmon]# nmon -f -s 36 -c 100
-f 表示生成的数据文件名中有时间;
-t 输出中包括占用率较高的进程;
-s 36 表示每 36 秒采集一次数据;
-c 100 表示采集 100 次,36s*100=3600秒;
采集60分钟数据,这样运行一次这个程序就会生成一个采集 60分钟数据的文件。该行命令将在当前目录中创建输出文件,其名称为:<hostname>_date_time.nmon", hostname" 是这台主机的主机名。
在采集当中也可以通过命令
ps -ef | grep nmon 查看采集数据的进程
[root@lamw /home/lam7/nmon]# ps -ef | grep nmon
60分钟后 再次执行 此命令可以发现 进程已结束
在我们当前目录下可以查看到 以 ****_170323_1102.nmon 命名的文件 “***”为主机名称
我们通过more命令后发现都是我们看不懂的一些文本,这就需要我们把其转化成我们能看懂的excel格式的文件。首先我们把****_170323_1102.nmon文件导出到我们的windows本地。然后通过nmon Analyser 去生成报告CSV文件
下载安装 nmon Analyser
https://www.ibm.com/developerworks/community/wikis/home?lang=en#!/wiki/Power+Systems/page/nmon_analyser
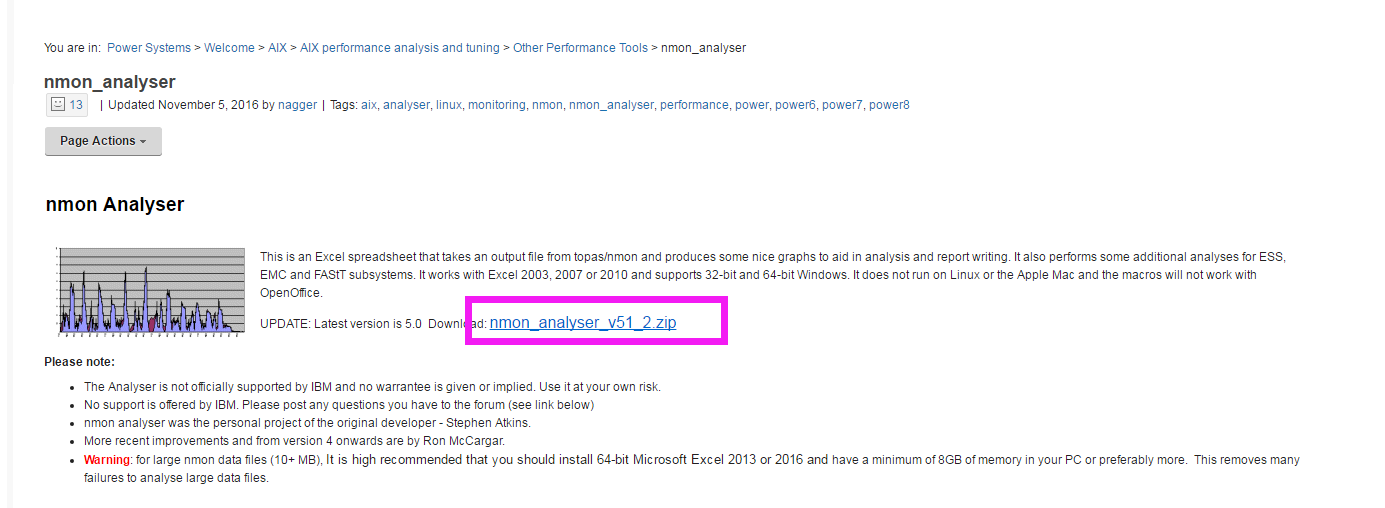
下载解压后 发现 一个是NA_UserGuide v51_2.docx的说明word格式的说明文档,另一个是nmon analyser v51_2.xlsm格式的nmon analyse文件。
打开nmon analyser v51_2.xlsm 导入从linux中导出的 ****_170323_1102.nmon文件,生成报告excel文档
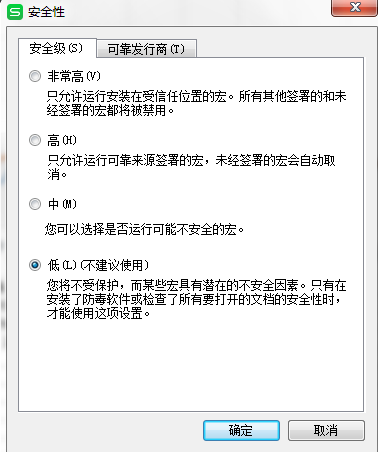
如果是用WPS打开nmon analyser v51_2.xlsm的,会提示安装 宏 ,wps是不带宏的,安装 宏 之后 调整Excel宏安全性:工具--宏--安全性----低
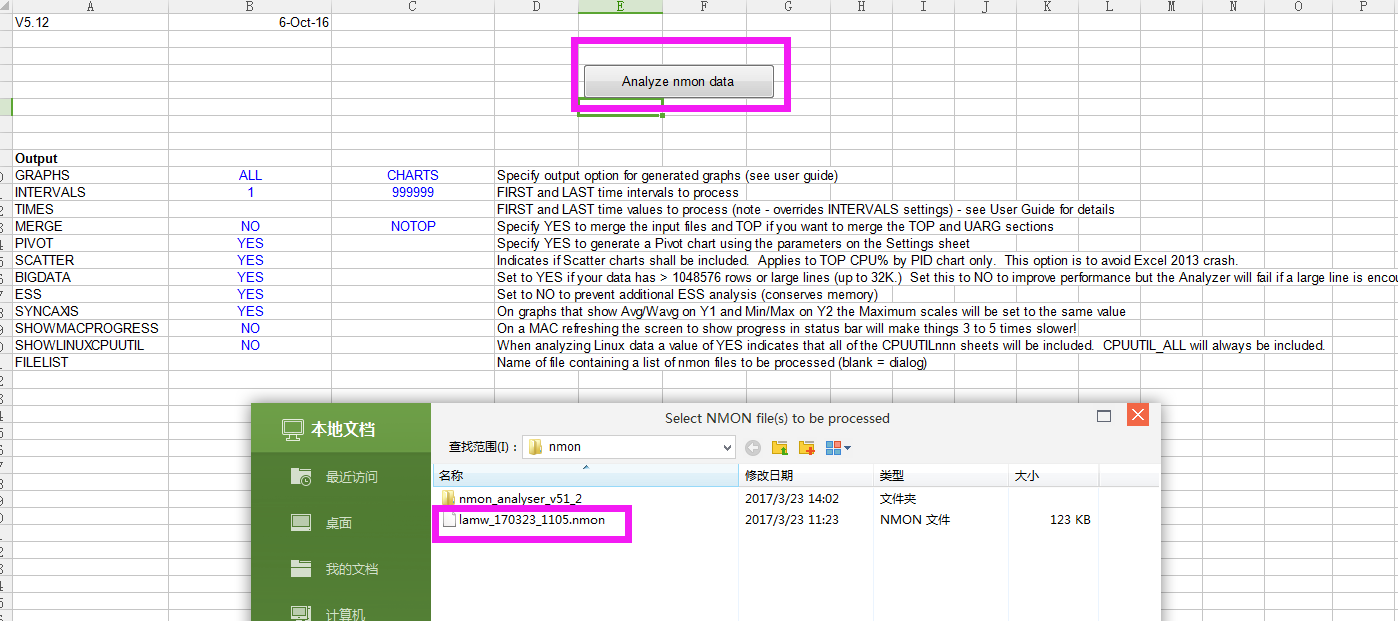
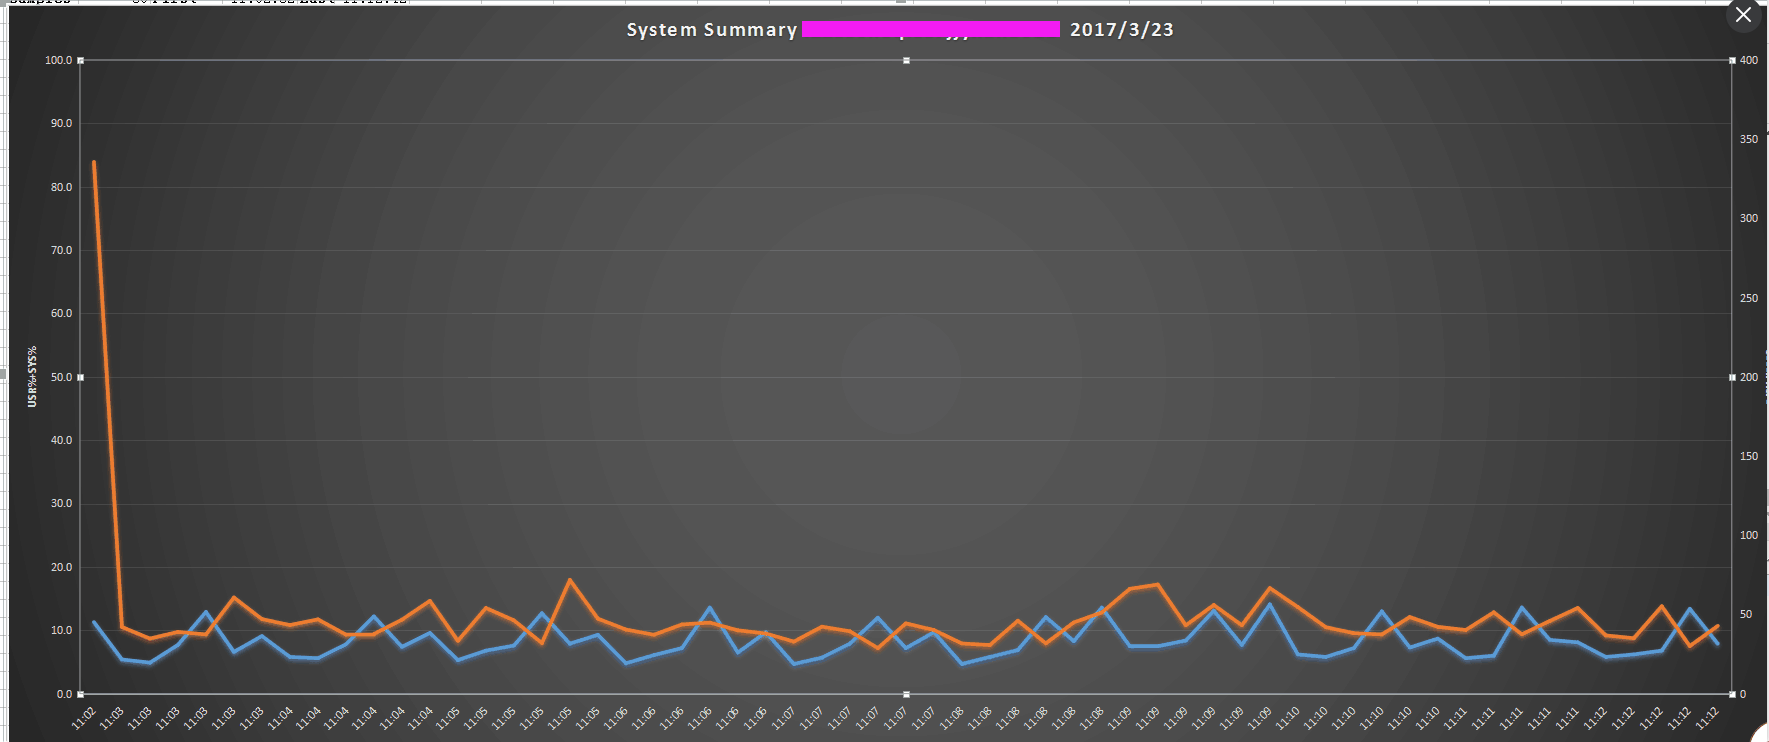

可以切换 展示的图片格式 查看所监控的数据信息
橙色 :系列"IO/sec"
蓝色 : 系列"CPU%"
最新文章
- 深入理解javascript函数系列第二篇——函数参数
- MongoDB的数据库基本操作(一)
- OAuth2.0 微博登陆网站功能的实现(一)获取用户授权及令牌 Access Token
- 2Sigma OA prepare: Longest Chain
- 在XcodeGhost事件之后,获取更纯净的Xcode的方法。
- LIS-Program E
- Java之组合数组2
- maven 练习
- C# 文件管理类 Directory
- ubuntu下允许root用户ssh远程登录
- HDU 3259 Wormholes
- NYoj 最舒适的路线
- IOS 类的属性修饰符atomic
- uname命令
- DELPHI XE8 远程调试
- Python md5解密
- WPF自定义轮播控件
- Linux查看端口占用情况并释放端口占用
- 更改linux下文件目录权限、拥有者及用户组
- Oracle推进SCN系列:使用oradebug在mount状态下推进SCN