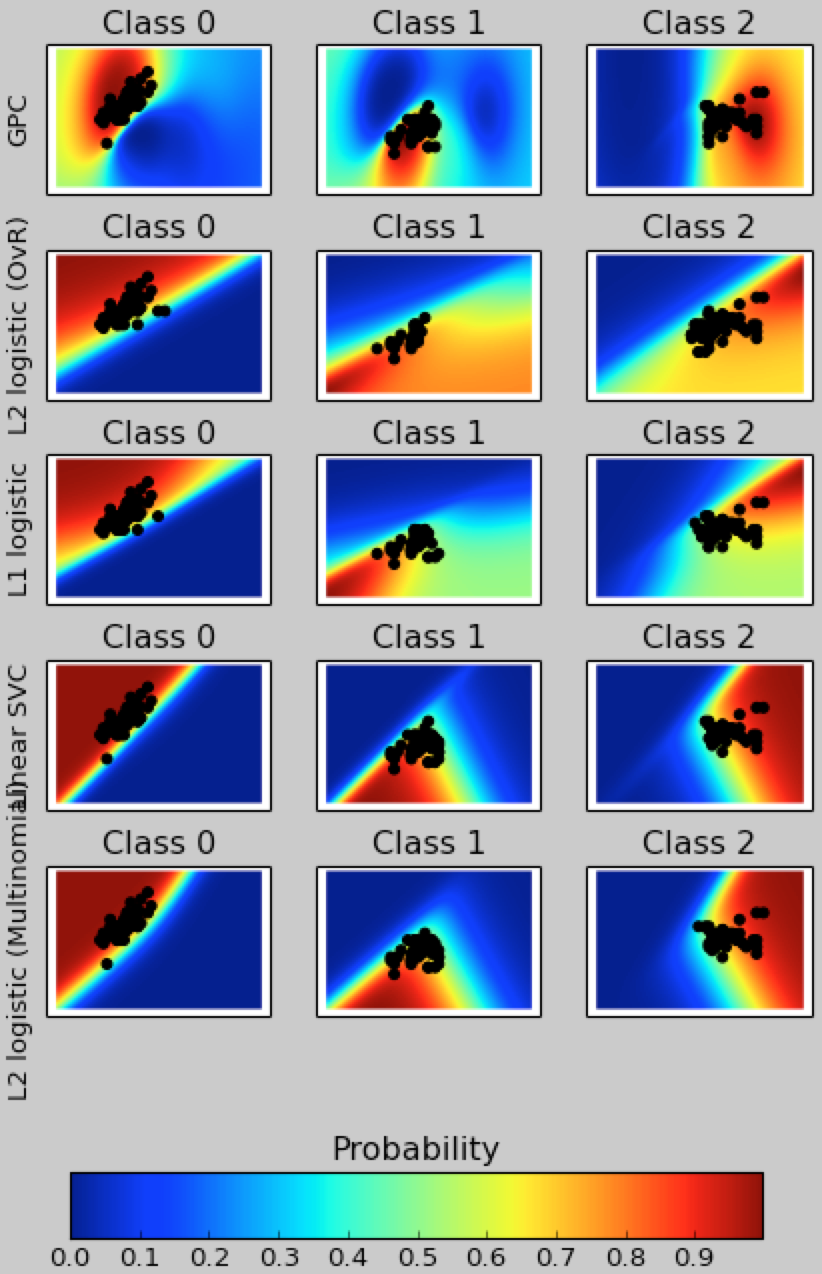
使用sklean进行多分类下的二分类
2024-09-04 12:05:52
#coding:utf-8

import matplotlib.pyplot as plt

import numpy as np

from sklearn.linear_model import LogisticRegression

from sklearn.svm import SVC

from sklearn.gaussian_process import GaussianProcessClassifier

from sklearn.gaussian_process.kernels import RBF

from sklearn import datasets

iris = datasets.load_iris()

#花萼长度    花萼宽度

X = iris.data[:, 0:2]  # we only take the first two features for visualization

#所属种类

y = iris.target

print X.shape

print y

#两个因数

n_features = X.shape[1]

C = 1.0

kernel = 1.0 * RBF([1.0, 1.0])  # for GPC

# Create different classifiers. The logistic regression cannot do

# multiclass out of the box.

classifiers = {'L1 logistic': LogisticRegression(C=C, penalty='l1'),

               'L2 logistic (OvR)': LogisticRegression(C=C, penalty='l2'),

               'Linear SVC': SVC(kernel='linear', C=C, probability=True,random_state=0),

               'L2 logistic (Multinomial)': LogisticRegression(C=C, solver='lbfgs', multi_class='multinomial'),

               'GPC': GaussianProcessClassifier(kernel)

               }

n_classifiers = len(classifiers)

plt.figure(figsize=(3 * 2, n_classifiers * 2))

plt.subplots_adjust(bottom=.2, top=.95)

#3-9 的100个平均分布的值

xx = np.linspace(3, 9, 100)

#1-5 的100个平均分布的值

yy = np.linspace(1, 5, 100).T

#

xx, yy = np.meshgrid(xx, yy)

#纵列连接数据 构造虚拟:花萼长度    花萼宽度

Xfull = np.c_[xx.ravel(), yy.ravel()]

for index, (name, classifier) in enumerate(classifiers.items()):

    classifier.fit(X, y)

    y_pred = classifier.predict(X)

    classif_rate = np.mean(y_pred.ravel() == y.ravel()) * 100

    print("classif_rate for %s : %f " % (name, classif_rate))

    # 查看预测概率

    probas = classifier.predict_proba(Xfull)

    #3个种类

    n_classes = np.unique(y_pred).size

    for k in range(n_classes):

        plt.subplot(n_classifiers, n_classes, index * n_classes + k + 1)

        plt.title("Class %d" % k)

        if k == 0:

            plt.ylabel(name)

        #构造颜色

        imshow_handle = plt.imshow(probas[:, k].reshape((100, 100)),extent=(3, 9, 1, 5), origin='lower')

        plt.xticks(())

        plt.yticks(())

        idx = (y_pred == k)

        if idx.any():

            plt.scatter(X[idx, 0], X[idx, 1], marker='o', c='k')

ax = plt.axes([0.15, 0.04, 0.7, 0.05])

plt.title("Probability")

plt.colorbar(imshow_handle, cax=ax, orientation='horizontal')

plt.show()
最新文章
- bind绑定多个事件切换
- 金士顿U盘,群联PS2251-60主控,量产还原教程
- Default团队项目立题
- PMBOK/CMM/CMMI/OPM3
- 图像特征提取之(一)HOG特征
- 如何重装air
- Spring Controller 获取请求参数的几种方法
- PHP中正则替换函数preg_replace用法笔记
- eNSP关闭保存文件的提示信息
- Python3源码学习-requests
- 10分钟学会使用YOLO及Opencv实现目标检测(下)|附源码
- Jmeter测试http+JSON配置相关
- mysql查看连接数排查问题
- 解决Android Studio在Ubuntu上出现“sdk/platform-tools/adb: error=2, No such file or directory”的方法
- 背景图片的移动----background-attach-----background-repeat
- SDE在64位Server2008下Post启动服务失败官方解释
- docker参数--restart=always的作用
- junit 知识点
- Django入门指南-第9章:静态文件设置(完结)
- SICP读书笔记 2.5