NG-ZORRO + Angular11使用Echarts实现柱折线图-折柱混合,并给图表添加点击打印图表数据!!!详细代码
2024-09-07 20:20:19
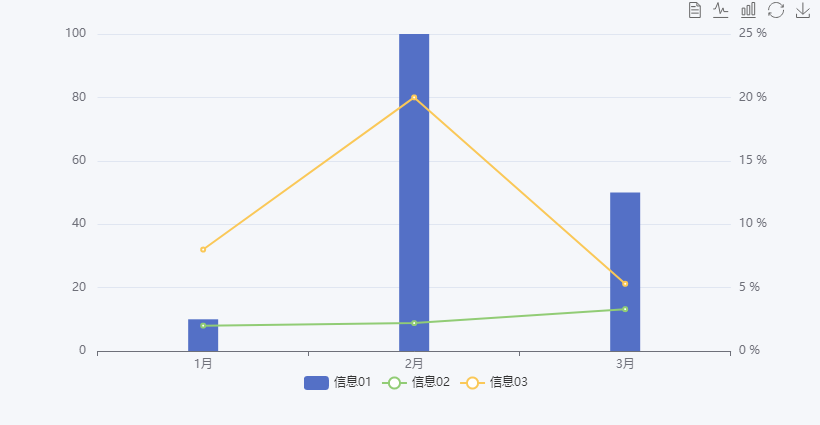
先上效果图
HTML代码
<div echarts #myEchart [options]="option"></div>
ts代码
import { Component, OnInit, ViewChild, ElementRef } from '@angular/core';

import { NgxEchartsService } from 'ngx-echarts';

@Component({

  selector: 'app-oee-report',

  templateUrl: './oee-report.component.html',

  styleUrls: ['./oee-report.component.less'],

})

export class MyTestComponent implements OnInit {

  constructor(

    private es: NgxEchartsService,

  ) { }

  option = {

    tooltip: {

        trigger: 'axis',

        axisPointer: {

            type: 'cross',

            crossStyle: {

                color: '#999'

            }

        }

    },

    toolbox: {

        feature: {

            dataView: {show: true, readOnly: false},

            magicType: {show: true, type: ['line', 'bar']},

            restore: {show: true},

            saveAsImage: {show: true}

        }

    },

    legend: {

      data: ['信息01','信息02','信息03'],

      bottom: '0px'

    },

    xAxis: [

        {

            type: 'category',

            data: ['1月', '2月', '3月'], // x轴显示的内容

            axisPointer: {

                type: 'shadow'

            }

        }

    ],

    yAxis: [

        {

            type: 'value',

            name: '',

            min: 0,

            max: 100,

            interval: 20,

            axisLabel: {

                formatter: '{value} '

            }

        },

        {

            type: 'value',

            name: '',

            min: 0,

            max: 25,

            interval: 5,

            axisLabel: {

                formatter: '{value} %'

            }

        }

    ],

    grid: { // 控制距離上下左右距離

      left: 50, // 配合设置barWidth

      right: 50,

      top: 39,

      bottom: 24,

      containLabel: true

    },

    series: [

        {

            name: '信息01',

            type: 'bar', // x轴对应的数据

            barWidth: 30,

            data: [10,100, 50]

        },

        {

            name: '信息02',

            type: 'line',

            yAxisIndex: 1,

            data: [2.0, 2.2, 3.3]

        },

        {

            name: '信息03',

            type: 'line',

            yAxisIndex: 1,

            data: [8.0, 20, 5.3]

        }

    ]

  };

  @ViewChild('myEchart', { static: false }) myEchart: ElementRef;

  ngOnInit(): void {

  }

  ngAfterViewInit(){

    this.test()

  }

  test() {

  this.es.getInstanceByDom(this.myEchart.nativeElement).setOption(this.option);

   // 添加点击事件代码

   let myChart = this.es.getInstanceByDom(this.myEchart.nativeElement)

   myChart.getZr().on('click',  params=> {

     var pointInPixel = [params.offsetX, params.offsetY];

     if (myChart.containPixel('grid', pointInPixel)) {

       /*此处添加具体执行代码*/

       var pointInGrid = myChart.convertFromPixel({ seriesIndex: 0 }, pointInPixel);

       //X轴序号

       var xIndex = pointInGrid[0];

       //获取当前图表的option

       var op = myChart.getOption();

       //获得图表中我们想要的数据---下面就不简写了,默认说我们的折现有2条吧

       var xValue = op.xAxis[0].data[xIndex];

       var value = op.series[0].data[xIndex];

       var name = op.series[0].name;

       var value1 = op.series[1].data[xIndex];

       var name1 = op.series[1].name;

       var value2 = op.series[2].data[xIndex];

       var name2 = op.series[2].name;

       console.log(op);

       console.log('xValue: '+xValue + ", series[0].name0: "+name +' , value: '+ value);

       console.log('xValue: '+xValue + ", series[1].name0: "+name1 +' , value1: '+ value1 + "%");

       console.log('xValue: '+xValue + ", series[2].name0: "+name2 +' , value2: '+ value2 + "%");

     }

   });

   // 添加点击事件代码

  }

}
最新文章
- 在一定[min,max]区间,生成n个不重复的随机数的封装函数
- js冒泡排序与二分法查找
- tomcat、腾讯云主机和微信
- html5 canvas画图之图形随拖动而复制(有操作指示)
- Android doc打开太慢
- 转!!Java中关于Null的9个解释(Java Null详解)
- STL使用sort注意的问题
- UIPickerView 简单操作和实际应用
- BZOJ 2763: [JLOI2011]飞行路线 spfa dp
- bzoj2801
- OC4_单例
- AndroidのUI设计研究(一)——自定义ProgressBar
- linux系统编程:IO读写过程的原子性操作实验
- 从二进制数据流中构造GDAL可以读取的图像数据(C#)
- Avro序列化与反序列化
- 对PDF的操作
- SharePoint自动化部署,利用PowerShell 导出/导入AD中的用户
- 各大OJ题目分类
- nyoj 吃土豆
- css动画笔记