ASP.NET Core +Highchart+ajax绘制动态柱状图
2024-09-01 18:17:31
一.项目介绍
利用前端Highchart,以及ajax向后台获取数据,绘制动态柱状图。hightchart其他实例可查看官网文档。[Highchart](https://www.highcharts.com.cn)
二.准备工作
先搭建项目以及所要访问的数据库及数据,这里不做赘述。
然后编写Controller代码,用于提供数据。
 [HttpPost]

 public JsonResult GetDataList(int BeformDays, int Type)

 {

 JsonResultData json = new JsonResultData();

 json.datas.Add(new Detail {

 name="测试总数"

 });

 json.datas.Add(new Detail

 {

 name = "测试失败"

 });

 json.datas.Add(new Detail

 {

 name = "测试成功"

 });

 var list=_dataContext.Responses.ToList();

 if (Type == )

 {

 foreach (var item in list)

 {

 json.names.Add(item.ClientName);

 //json.testSuccessNum.Add(item.TestSuccessNum);

 json.datas.FirstOrDefault(o => o.name == "测试总数").data .Add(item.TestNum);

 json.datas.FirstOrDefault(o => o.name == "测试成功").data.Add(item.TestSuccessNum);

 json.datas.FirstOrDefault(o => o.name == "测试失败").data.Add(item.TestNum-item.TestSuccessNum);

 }

 }

 return Json(json);

 }
二.前端代码
先引用需要用到的js包,如下:
```
<script src="http://cdn.highcharts.com.cn/highcharts/highcharts.js"></script>

<script src="https://code.highcharts.com.cn/jquery/jquery-1.8.3.min.js"></script>

<script src="https://code.highcharts.com.cn/highcharts/modules/exporting.js"></script>

<script src="https://code.highcharts.com.cn/highcharts/modules/data.js"></script>

<script src="https://code.highcharts.com.cn/highcharts/modules/series-label.js"></script>

<script src="https://code.highcharts.com.cn/highcharts/modules/oldie.js"></script>

<script src="https://code.highcharts.com.cn/highcharts-plugins/highcharts-zh_CN.js">	</script>

<script src="https://code.highcharts.com.cn/jquery/jquery-1.8.3.min.js"></script>
js代码如下:
 <script type="text/javascript">

 //DrawHistogram();

 $(document).ready(function () {

 DrawHistogram("container");//页面加载,异步运行该方法

 });

 setInterval(function () {

 DrawHistogram("container");

 }, 1000 * 60);//定时刷新数据

 function DrawHistogram(id) {

 var chart;

 //获取数据

 $.ajax({

 async: false,

 type: 'post',

 datatype: 'json',

 url: '/home/getdatalist',

 data: { BeformDays: 7, Type: 1 },

 success: function (Data) {

 Name = Data.names;

 //highchants样式渲染

 chart = new Highcharts.Chart({

 chart: {

 renderTo: id,//放置图表的容器

 plotBackgroundColor: null,//绘图背景颜色

 plotBorderWidth: null,//绘图边框宽度

 defaultSeriesType: 'column'//图表类型样式line, spline, area, areaspline, column, bar, pie , scatter这些样式随你选

 },

 title: {

 text: '柱状图统计'

 },

 subtitle: {

 text: ''//副标题

 },

 xAxis: {//X轴数据

 categories: Data.names,//请求到的json数据

 labels: {

 rotation: 0, //字体倾斜

 align: 'right',

 style: { font: 'normal 13px 宋体' }

 }

 },

 yAxis: {//Y轴显示文字

 title: {

 text: '个数/个'

 }

 },

 //点击事件

 tooltip: {

 enabled: true,//是否显示tooltip

 formatter: function () {

 return '<b>' + this.x + '</b><br/>' + this.series.name + ': ' + Highcharts.numberFormat(this.y, 1);

 }

 },

 plotOptions: {

 line: {

 dataLabels: {

 enabled: true

 },

 enableMouseTracking: true//是否显示title

 }

 },

 series: Data.datas//json

 });

 //setInterval("getjson()", 3000);

 }

 });

 }

 </script>

 ```

 在html页面添加容器,html代码如下:

 ```

 <body>

 <!--存放内容-->

 <div id="container">

 </div>

 </body>
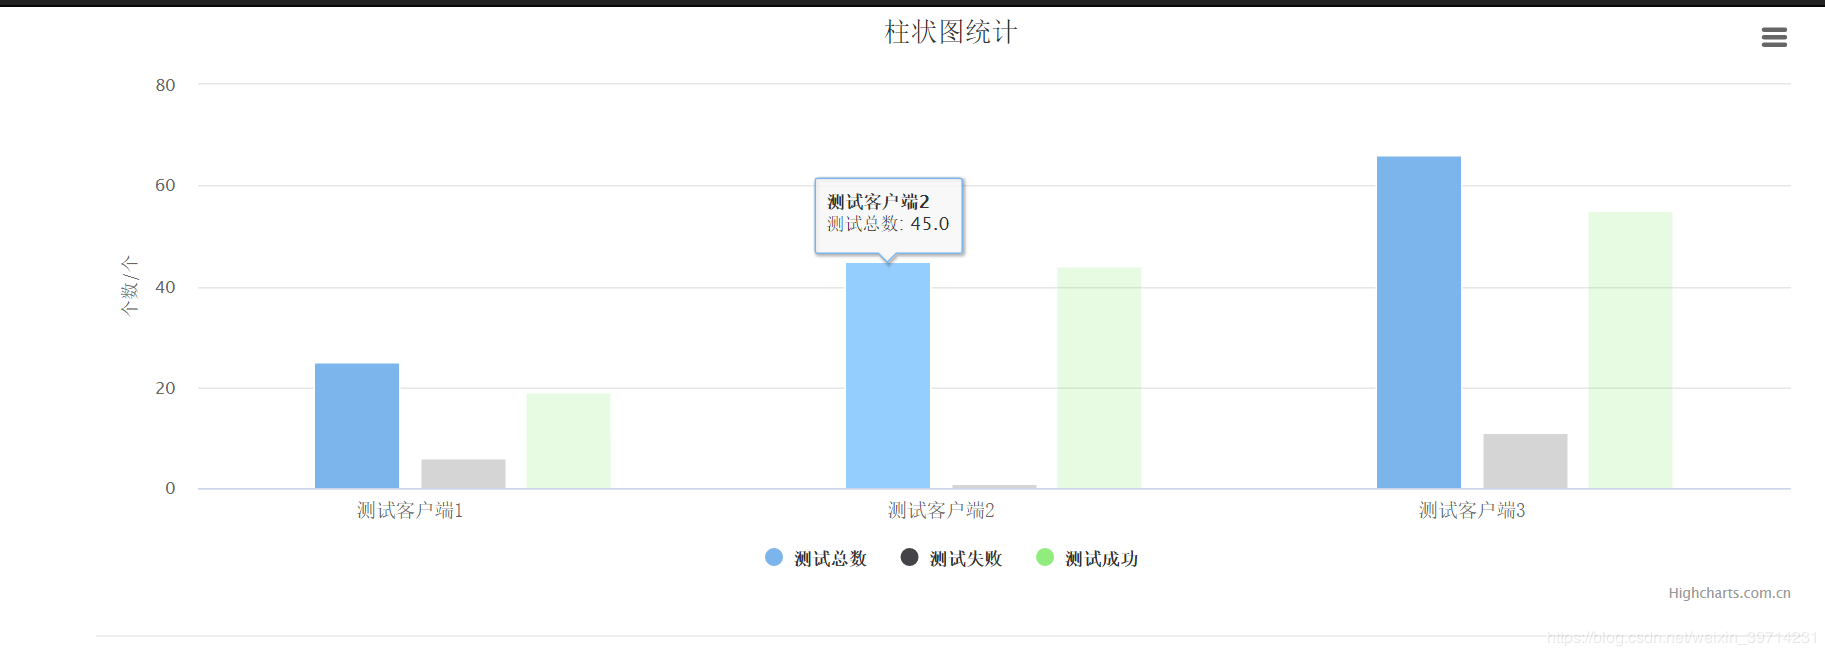
效果图:
最新文章
- 运动规划 (Motion Planning): MoveIt! 与 OMPL
- C——第一阶段结束
- HTML5学习(六)---------SVG 与Canvas
- 06_例子讲解:rlPlanDemo
- WPF界面设计技巧(4)—自定义列表项样式
- Linux/UNIX先进I/O
- Swift三元条件运算
- h5 测试关注点
- inner join 与 left join 之间的区别
- python之路--反射
- base64encode 编码原理
- [Java]Spring框架
- Ubuntu16.04配置apache+php+mysql
- 如何实现字符串的翻转,不用php库函数翻转字符串
- BZOJ2844: albus就是要第一个出场(线性基)
- [转].Net Core上用于代替System.Drawing的类库
- Python urllib模块详解
- 24个节点测试Linux VPS/服务器速度一键脚本使用 附服务器配置
- LightOJ - 1027 A Dangerous Maze —— 期望
- oracle 代码块