python之histogram
histogram
A histogram is an accurate representation of the distribution of numerical data. It is an estimate of the probability distribution of a continuous variable (quantitative variable) and was first introduced by Karl Pearson.To construct a histogram, the first step is to "bin" (or "bucket") the range of values—that is, divide the entire range of values into a series of intervals—and then count how many values fall into each interval. The bins are usually specified as consecutive, non-overlapping intervals of a variable. The bins (intervals) must be adjacent, and are often (but are not required to be) of equal size.
matplotlib.pyplot.hist
matplotlib.pyplot.hist(x, bins=None, range=None, density=None, weights=None, cumulative=False, bottom=None, histtype='bar', align='mid', orientation='vertical', rwidth=None, log=False, color=None, label=None, stacked=False, normed=None, hold=None, data=None, ***kwargs*)
Plot a histogram.
Compute and draw the histogram of x. The return value is a tuple (n, bins, patches) or ([n0, n1, …], bins, [patches0, patches1,…]) if the input contains multiple data.
Multiple data can be provided via x as a list of datasets of potentially different length ([x0, x1, …]), or as a 2-D ndarray in which each column is a dataset. Note that the ndarray form is transposed relative to the list form.
Masked arrays are not supported at present.
parameters
x : (n,) array or sequence of (n,) arrays
Input values, this takes either a single array or a sequence of arrays which are not required to be of the same length.
bins : integer or sequence or ‘auto’, optional
bins 即是 根据x中的数据集 划分 合适的组数。一般可以先用'auto',然后在此基础上对bins进行微调。
If an integer is given, bins + 1 bin edges are calculated and returned, consistent with numpy.histogram().
If bins is a sequence, gives bin edges, including left edge of first bin and right edge of last bin. In this case, bins is returned unmodified.
All but the last (righthand-most) bin is half-open. In other words, if bins is:
[1, 2, 3, 4]
then the first bin is [1, 2) (including 1, but excluding 2) and the second [2, 3). The last bin, however, is [3, 4], which includes 4.
Unequally spaced bins are supported if bins is a sequence.
If Numpy 1.11 is installed, may also be 'auto'.
Default is taken from the rcParam hist.bins.
density : boolean, optional
If True, the first element of the return tuple will be the counts normalized to form a probability density, i.e., the area (or integral) under the histogram will sum to 1. This is achieved by dividing the count by the number of observations times the bin width and not dividing by the total number of observations. If stacked is also True, the sum of the histograms is normalized to 1.
Default is None for both normed and density. If either is set, then that value will be used. If neither are set, then the args will be treated as False.
If both density and normed are set an error is raised.
returns
n : array or list of arrays
The values of the histogram bins. See normed or density and weights for a description of the possible semantics. If input x is an array, then this is an array of length nbins. If input is a sequence arrays [data1, data2,..], then this is a list of arrays with the values of the histograms for each of the arrays in the same order.
默认,n 返回 落在每个区间里的数 的频数 的list;若指定density = True,n 返回 每个区间的概率密度值的列表
bins : array
The edges of the bins. Length nbins + 1 (nbins left edges and right edge of last bin). Always a single array even when multiple data sets are passed in.
patches : list or list of lists
Silent list of individual patches used to create the histogram or list of such list if multiple input datasets.
例子
ex1
#!/usr/bin/env python3

#-*- coding:utf-8 -*-

############################

#File Name: hist.py

#Brief:

#Author: frank

#Mail: frank0903@aliyun.com

#Created Time:2018-06-13 22:03:35

############################

import matplotlib.pyplot as plt

import numpy as np

a = [34, 40, 37, 30, 44, 36, 32, 26, 32, 36]

n,bins,patches = plt.hist(a,bins='auto')

print("n:{}, bins:{},pathes:{}".format(n,bins,patches))

plt.show()
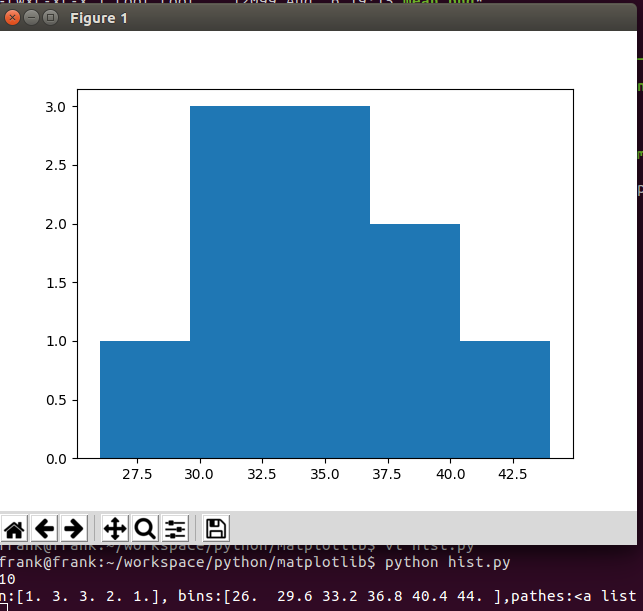
从上例可知,bins 区间的个数为5个,即
[26,29.6], 落在 [26,29.6] 里的数是26, 频数是1
[29.6,33.2],落在[29.6,33.2]里的数是 30,32,32,频数是3
[33.2,36.8],落在[33.2,36.8]里的数是 34,36,36,频数是3
[36.8,40.4],落在[36.8,40.4]里的数是 37,40,频数是2
[40.4,44],落在[40.4,44]里的数是44,频数是1
ex2
看density参数对直方图的影响
#!/usr/bin/env python3

#-*- coding:utf-8 -*-

############################

#File Name: hist.py

#Brief:

#Author: frank

#Mail: frank0903@aliyun.com

#Created Time:2018-06-13 22:03:35

############################

import matplotlib.pyplot as plt

import numpy as np

a = [34, 40, 37, 30, 44, 36, 32, 26, 32, 36]

n,bins,patches = plt.hist(a,bins='auto',density=True)

print("n:{}, bins:{},pathes:{}".format(n,bins,patches))

plt.show()
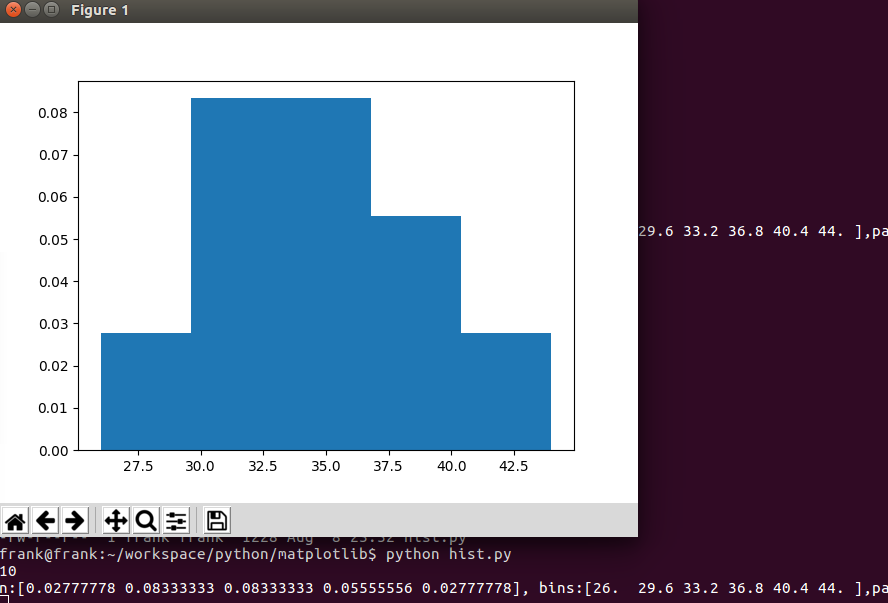
从上例可知,当density为True时,直方图的y轴表示的是概率密度值。
\(\text{the bin width}=\frac {max-min}{bins}=\frac{44-26}{5}=3.6\)
[26,29.6], 落在 [26,29.6] 里的数是26, 频数是1,\(\frac {频数}{\text{the number of observations} \cdot \text{the bin width}}=\frac {1}{10\cdot 3.6}=0.02777778\)
其他区间的类似
最新文章
- 云瓣影音网站&&微信端(已开源)
- 【WPF】日常笔记
- 拷贝excel里的内容转为JSON的js代码
- github指令
- 【JS复习笔记】00 序
- Ajax的实现
- WebStorm9
- chrome 模拟点击
- PHP调试工具 《Kint》
- Xamarin之 环境错误集锦
- MVC文件夹及文件说明
- java推送数据到app--极光推送
- PHP指定日期转时间戳
- yum clear all无反应
- haproxy(8):haproxy代理MySQL要考虑的问题
- c#编程模仿的1stopt界面
- .Net多线程之线程安全
- 从两个TIMESTAMP中获取时间差(秒)
- db2 常用类型
- P2P通信标准协议(二)之TURN
热门文章
- toFixed()方法
- threadlocal 变量 跟synchronized 关键字的关系
- dbus启动失败:Couldn't connect to system bus: Unable to autolaunch a dbus-daemon without a $DISPLAY for X11
- RocketMQ-创建MappedFile本地文件
- Microsoft.Office.Workflow.Actions Namespace
- CUDA编程札记
- cocos2d-x 托付模式的巧妙运用——附源代码(二)
- Android传感器的介绍
- Unity3D调用摄像头显示当前拍摄画面
- [Exception Spring 1] - Attribute value must not be null