gnuplot examples
2024-08-30 04:32:11
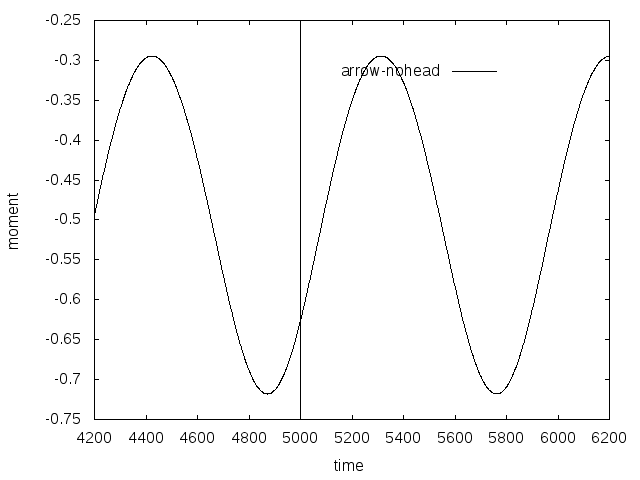
add dashed vertical line
#set terminal pdf

#set output 'c_p_tsr5.5_sine_udf_e387.pdf'

set terminal postscript eps enhanced color font 20 size 8in, 6in

set out 'vertical_line.eps'

#set terminal X11

set autoscale

unset log

unset label

unset pm3d

set key at graph .8, .9

set key spacing 1.2

set xtic auto

set ytic auto

set xlabel  "time"

set xrange [*:*]

# r0 initial pulse

set yrange [*:*]

set ylabel "moment"

set style line 1 lt 1 lc rgb "black" lw 1

set style line 2 lt 2 lc rgb "red" lw 4

set style line 3 lt 3 lc rgb "purple" lw 3

set style line 4 lt 4 lc rgb "blue" lw 3

set style line 5 lt 5 lc rgb "black" lw 2

set style line 6 lt 6 lc rgb "brown" lw 3

# vertical line

set arrow 1 from 5000,-0.75 to 5000,-0.25 nohead dt "."

plot "cm-sine-udf.out"  using 1:3 t "arrow-nohead" ls 1 with lines
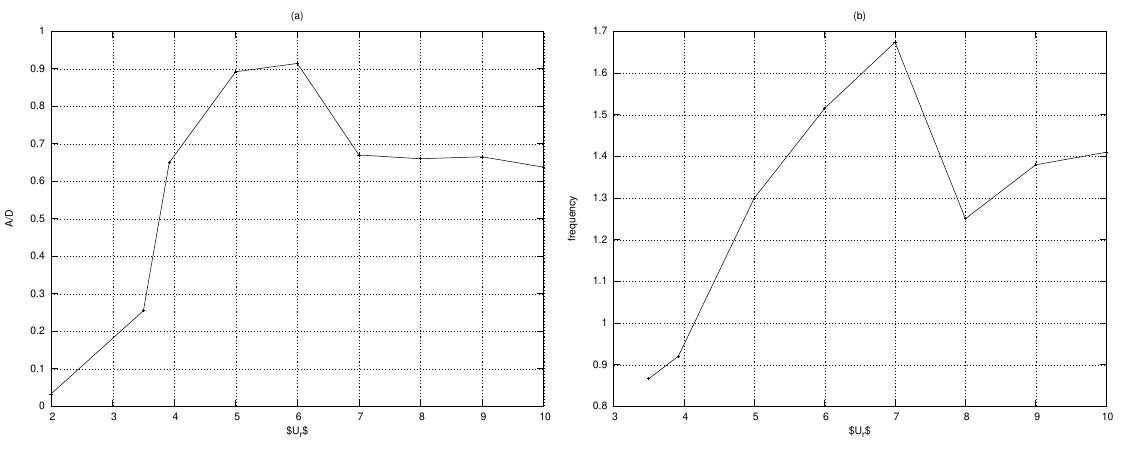
two figures side by side
# multiplot
#set terminal svg  font "Arial"enhanced size 700, 600

#set output "multiplt1.svg"

# eps

set terminal postscript eps font 10 size 7.5in, 6in

set out 'multiplt1.eps'

set style line 1  linecolor rgb "black"  linewidth 1.000 lt 1 pointtype 1 ps 0.5

set style line 2  linecolor rgb "black"  linewidth 2.000 lt 2 pointtype 3 ps 0.

set size 1.0, 0.5

set origin 0.0, 0.0

set multiplot

set grid

unset key

set angles radians

set samples 250

#####################  -- figure 1

set xtic auto

set ytic auto

set size 0.5, 0.5

set origin 0.0, 0.0

set title "(a)"

set xlabel "$U_r$"

set ylabel "A/D"

set label 1 "Damping =.1,.2,.3,.4,.5,.707,1.0,2.0" at .14,17

set xrange [*:*]

set yrange [*:*]

plot  "amp.txt"  using 1:8 t "0.0"  ls 1 with linespoints

#######################  -- figure 2

set xtic auto

set ytic auto

set size 0.5,0.5

set origin 0.5,0.0

set title "(b)"

set label 1 ""

set xlabel "$U_r$"

set ylabel "frequency"

set xrange [*:*]

set yrange [*:*]

plot  "fre.txt"  using 1:2 title "0.005"  ls 1 with linespoints

unset multiplot
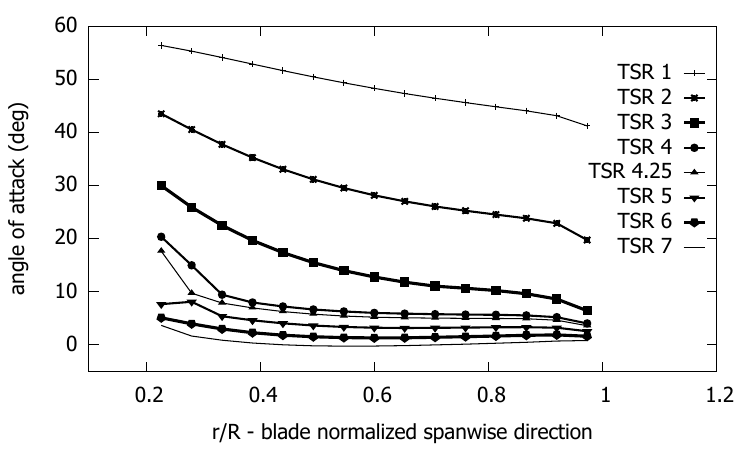
single plot
Code:
# set terminal jpeg

# set output 'alfa_epp_a7.jpg'

# set terminal postscript eps font 20

# set out 'alfa_tsr_e387.eps'

set terminal pdf

set output 'alfa_tsr_e387.pdf'

# set terminal X11

set autoscale

unset log

unset label

unset pm3d

set key ins vert

set key samplen 1

set key at graph 1, 0.9

set key spacing 1

set xtic auto

set ytic auto

set xlabel  "r/R - blade normalized spanwise direction"

set xrange [0.1:1.2]

# r0 initial pulse

set yrange [-5:*]

set ylabel "angle of attack (deg)"

set style line 1  linecolor rgb "black"  linewidth 1.000 lt 1 pointtype 1 ps 0.5

set style line 2  linecolor rgb "black"  linewidth 2.000 lt 2 pointtype 3 ps 0.5

set style line 3  linecolor rgb "black"  linewidth 3.000 lt 3 pointtype 5 ps 0.5

set style line 4  linecolor rgb "black"  linewidth 2.000 lt 4 pointtype 7 ps 0.5

set style line 5  linecolor rgb "black"  linewidth 1.000 lt 5 pointtype 9 ps 0.5

set style line 6  linecolor rgb "black"  linewidth 2.000 lt 6 pointtype 11 ps 0.5

set style line 7  linecolor rgb "black"  linewidth 3.000 lt 7  pointtype 13 ps 0.5

set style line 7  linecolor rgb "black"  linewidth 3.000 lt 7  pointtype 15 ps 0.5

plot "e387_bem/fort.101"  using 1:2 t "TSR 1" ls 1 with linespoints,\

"e387_bem/fort.105"  using 1:2 t "TSR 2" ls 2 with linespoints ,\

"e387_bem/fort.110" using 1:2 t "TSR 3" ls 3 with linespoints ,\

"e387_bem/fort.114" using 1:2 t "TSR 4" ls 4 with linespoints ,\

"e387_bem/fort.115" using 1:2 t "TSR 4.25" ls 5 with linespoints ,\

"e387_bem/fort.118" using 1:2 t "TSR 5" ls 6 with linespoints ,\

"e387_bem/fort.122" using 1:2 t "TSR 6" ls 7 with linespoints ,\

"e387_bem/fort.127" using 1:2 t "TSR 7" ls 8 with lines
output:
Code
#set terminal jpeg
#set output 'alfa.jpg'
set terminal postscript eps font 24
set out 'U_vs_X_tsr5.eps'
#set terminal X11
set autoscale
unset log
unset label
unset pm3d
set key at graph .99, .58
set key spacing 1
set xtic auto
set ytic auto
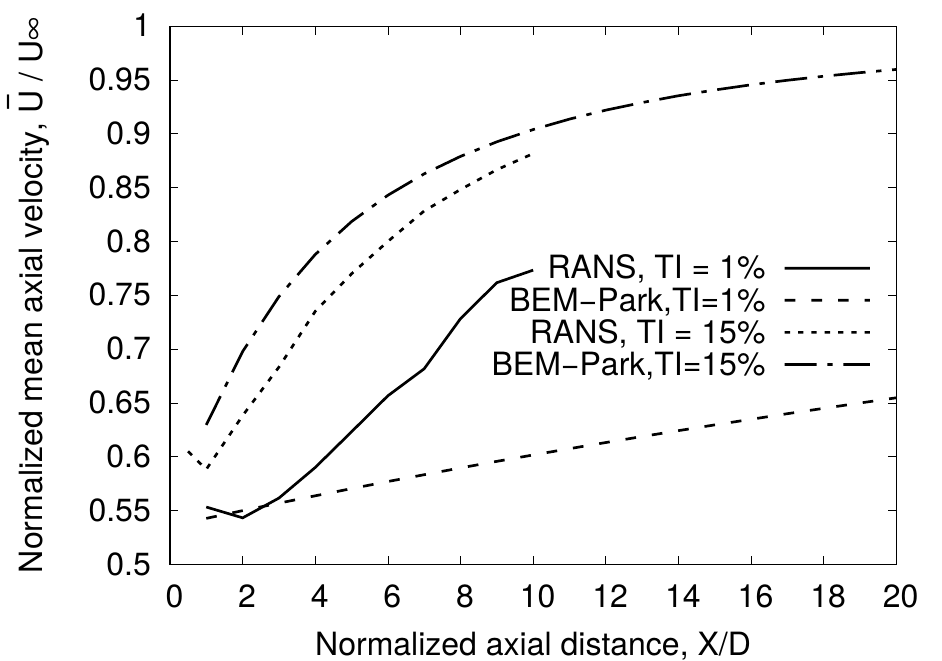
set xlabel "Normalized axial distance, X/D"
set xrange [*:*]
# r0 initial pulse
set yrange [*:*]
set ylabel "Normalized mean axial velocity, ~U{0.8-} / U{/Symbol \245}"
set style line 1 lt 1 lc rgb "black" lw 4 pt 1 ps 2
set style line 2 lt 2 lc rgb "black" lw 4 pt 3 ps 2
set style line 3 lt 3 lc rgb "black" lw 4 pt 5 ps 2
set style line 4 lt 4 lc rgb "black" lw 4 pt 7 ps 2
set style line 5 lt 5 lc rgb "black" lw 4
set style line 6 lt 6 lc rgb "brown" lw 4
#set label 1 "TSR 5" at graph .8, .9
plot "cfd/area_averaged_axial_mean_velocity_TI_1.txt" using 1:6 t "RANS, TI = 1%" ls 1 with lines,\
"park_model/wave_axial_velocity_tsr5_park_TI_1.txt" using 1:2 t "BEM-Park,TI=1%" ls 2 with lines,\
"cfd/area_averaged_axial_mean_velocity_TI_15.txt" using 1:6 t "RANS, TI = 15%" ls 3 with lines,\
"park_model/wave_axial_velocity_tsr5_park_TI_15.txt" using 1:2 t "BEM-Park,TI=15%" ls 4 with lines
example 2
important code
set key out horiz center top
#set terminal jpeg
#set output 'coeff_epp.jpg'
#set terminal png
#set output 'coeff_epp.png'
set terminal postscript eps font 24
set out 'coeff_naca0012.eps'
#set terminal X11
set autoscale
unset log
unset label
unset pm3d
set key out horiz center top
set xtic auto
set ytic auto
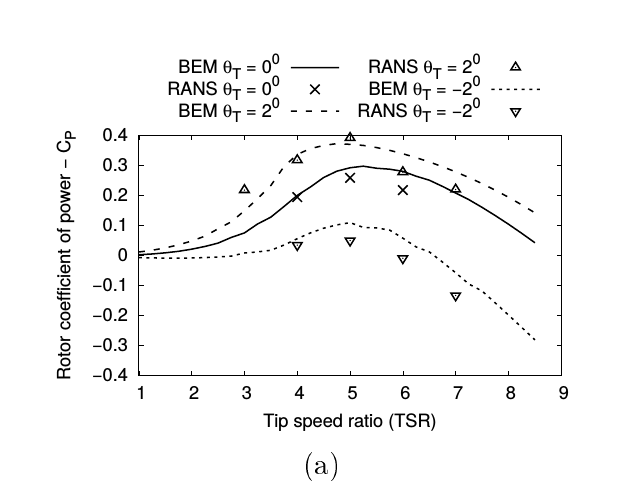
set xlabel "Tip speed ratio (TSR)"
set xrange [1:*]
# r0 initial pulse
set yrange [-0.4:0.4]
set ylabel "Rotor coefficient of power - C_P"
set style line 1 lt 1 lc rgb "black" lw 4 pointtype 2 pointsize 2
set style line 2 lt 2 lc rgb "black" lw 4 pointtype 7 pointsize 2
set style line 3 lt 3 lc rgb "black" lw 4 pointtype 6 pointsize 2
set style line 4 lt 4 lc rgb "black" lw 4 pointtype 8 pointsize 2
set style line 5 lt 5 lc rgb "black" lw 4 pointtype 10 pointsize 2
set style line 6 lt 6 lc rgb "brown" lw 4 pointtype 12 pointsize 2
set pointsize 2
set bars 3
plot "naca0012/re_135k/zero/coeff.plt" using 1:4 t "BEM {/Symbol q}_T = 0^{0}" ls 1 with lines ,\
"RANS/Cp_Ct_tsr_one_untwist.dat" using 1:2 t "RANS {/Symbol q}_T = 0^{0}" ls 1 with points ,\
"naca0012/re_135k/fwd_2/coeff.plt" using 1:4 t "BEM {/Symbol q}_T = 2^{0}" ls 2 with lines,\
"RANS/Cp_one_front_eldad_blade.dat" using 1:2 t "RANS {/Symbol q}_T = 2^{0}" ls 4 with points,\
"naca0012/re_135k/rear_2/coeff.plt" using 1:4 t "BEM {/Symbol q}_T = -2^{0}" ls 3 with lines,\
"RANS/Cp_Ct_tsr_one_rear.dat" using 1:2 t "RANS {/Symbol q}_T = -2^{0}" ls 5 with points
最新文章
- freeswitch 使用mysql替换默认的sqlite
- Flyout中ComboBox失效
- 学习ios(必看经典)牛人40天精通iOS开发的学习方法
- Android应用安全之外部动态加载DEX文件风险
- POJ - 1741 Tree
- healthkit 记录每天用户的运动情况
- Java对XML文档的增删改查
- SqlServer将数据库中的表复制到另一个数据库
- Oracle10g数据泵EXPDP和IMPDP备份与恢复数据
- pgsql 递归查询 分页
- c#通用配置文件读写类(xml,ini,json)
- 我的Android进阶之旅------> Android在TextView中显示图片方法
- 为WebClient增加Cookie的支持
- Android中的线程池
- 从.Net到Java学习第五篇——Spring Boot &&Profile &&Swagger2
- java-IO流-字节流-概述及分类、FileInputStream、FileOutputStream、available()方法、定义小数组、BufferedInputStream、BufferedOutputStream、flush和close方法的区别、流的标准处理异常代码
- Git 基础 - 远程仓库的使用
- Confluence 6 导入 Active Directory 服务器证书 - Mac OS X
- Java的进阶之道
- windows环境下mongodb下载、安装和使用总结