WPF实现统计图
WPF开发者QQ群: 340500857 | 微信群 -> 进入公众号主页 加入组织
前言
有小伙伴提出需要实现统计图。

由于在WPF中没有现成的统计图控件,所以我们自己实现一个。
PS:有更好的方式欢迎推荐。
代码如下
一、创建 BasicBarChart.cs 继承 Control代码如下。
BasicBarChart.cs实现思路如下
1、SeriesArray :存放展示集合 。
2、重写OnRender 。
3、先绘制X轴线。
4、调用GetFormattedText()绘制底部类别。
5、调用GetFormattedText()绘制左侧标尺。
6、DrawingContext绘制Line的时候会发虚,以下方法可以避免
var d = Pen.Thickness / 2;
var guidelines = new GuidelineSet(new[] { d }, new[] { d });
drawingContext.PushGuidelineSet(guidelines);
或者调用
SnapDrawingExtensions.DrawSnappedLinesBetweenPoints()
避免画线发虚。

using System;
using System.Collections.Generic;
using System.Globalization;
using System.Linq;
using System.Windows;
using System.Windows.Controls;
using System.Windows.Media; namespace WPFDevelopers.Controls
{
public class BasicBarChart : Control
{
public IEnumerable<KeyValuePair<string, double>> SeriesArray
{
get { return (IEnumerable<KeyValuePair<string, double>>)GetValue(SeriesArrayProperty); }
set { SetValue(SeriesArrayProperty, value); }
} public static readonly DependencyProperty SeriesArrayProperty =
DependencyProperty.Register("SeriesArray", typeof(IEnumerable<KeyValuePair<string, double>>), typeof(BasicBarChart), new UIPropertyMetadata(SeriesArrayChanged));
private static void SeriesArrayChanged(DependencyObject d, DependencyPropertyChangedEventArgs e)
{
BasicBarChart radarChart = d as BasicBarChart;
if (e.NewValue != null)
radarChart.InvalidateVisual();
} static BasicBarChart()
{
DefaultStyleKeyProperty.OverrideMetadata(typeof(BasicBarChart), new FrameworkPropertyMetadata(typeof(BasicBarChart)));
}
protected override void OnRender(DrawingContext drawingContext)
{
//base.OnRender(drawingContext);
if (SeriesArray == null || SeriesArray.Count() == 0)
return;
SnapsToDevicePixels = true;
UseLayoutRounding = true;
var brushConverter = new BrushConverter();
var myPen = new Pen
{
Thickness = 1,
Brush = (Brush)brushConverter.ConvertFromString("#6E7079")
};
myPen.Freeze(); //var d = myPen.Thickness / 2;
//var guidelines = new GuidelineSet(new[] { d }, new[] { d });
//drawingContext.PushGuidelineSet(guidelines); var h = this.ActualHeight / 2 + 160;
var w = this.ActualWidth / 2;
var startX = w / 3;
var width = SeriesArray.Count() * 120 + startX;
//drawingContext.DrawLine(myPen, new Point(startX, h), new Point(width, h));
var stratNum = 0; SnapDrawingExtensions.DrawSnappedLinesBetweenPoints(drawingContext,myPen,myPen.Thickness, new Point(startX, h), new Point(width, h));
var formattedText = GetFormattedText(stratNum.ToString());
drawingContext.DrawText(formattedText, new Point(startX - formattedText.Width * 2 - 10, h - formattedText.Height / 2));
var x = startX;
//var y = h + d;
var y = h + myPen.Thickness;
var points = new List<Point>();
var rectBrush = new SolidColorBrush((Color)ColorConverter.ConvertFromString("#5470C6"));
for (int i = 0; i < SeriesArray.Count() + 1; i++)
{
//drawingContext.DrawLine(myPen, new Point(x, y), new Point(x, y + 4));
points.Add(new Point(x, y));
points.Add(new Point(x, y + 4));
x = x + 120;
}
SnapDrawingExtensions.DrawSnappedLinesBetweenPoints(drawingContext, myPen, myPen.Thickness, points.ToArray()); var xAxisPen = new Pen
{
Thickness = 1,
Brush = (Brush)brushConverter.ConvertFromString("#E0E6F1")
};
xAxisPen.Freeze();
var xAxis = h - 80;
int max = Convert.ToInt32(SeriesArray.Max(kvp => kvp.Value));
max = (max / 50 + (max % 50 == 0 ? 0 : 1)) * 50 / 50;
int min = Convert.ToInt32(SeriesArray.Min(kvp => kvp.Value));
points.Clear();
for (int i = 0; i < max; i++)
{
//drawingContext.DrawLine(xAxisPen, new Point(startX, xAxis), new Point(width, xAxis));
points.Add(new Point(startX, xAxis));
points.Add(new Point(width, xAxis));
stratNum += 50;
formattedText = GetFormattedText(stratNum.ToString());
drawingContext.DrawText(formattedText, new Point(startX - formattedText.Width - 10, xAxis - formattedText.Height / 2));
xAxis = xAxis - 80;
}
SnapDrawingExtensions.DrawSnappedLinesBetweenPoints(drawingContext, xAxisPen, xAxisPen.Thickness, points.ToArray()); x = startX;
var rectWidth = 85;
var rectHeight = 0D;
for (int i = 0; i < SeriesArray.Count(); i++)
{
formattedText = GetFormattedText(SeriesArray.ToList()[i].Key);
drawingContext.DrawText(formattedText, new Point(x + 120 / 2 - formattedText.Width / 2, y + 4));
var _value = SeriesArray.ToList()[i].Value;
//rectHeight = _value * 200;
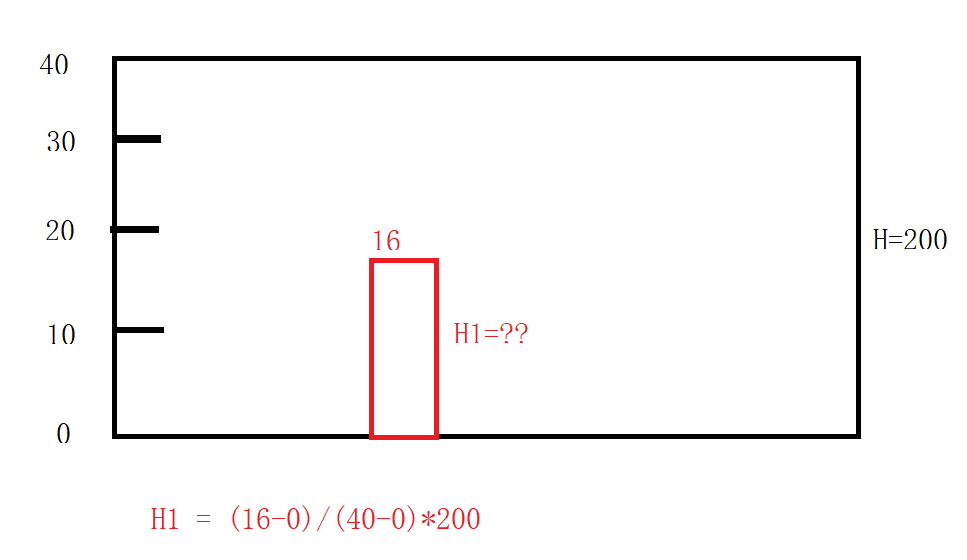
rectHeight = (_value - 0) / (stratNum - 0) * (80 * max);
//rectHeight = (stratNum - _value) / 100 * stratNum;
drawingContext.DrawRectangle(rectBrush, null, new Rect(x + (120 - 85) / 2, h - rectHeight, rectWidth, rectHeight));
x = x + 120;
}
}
FormattedText GetFormattedText(string text)
{
var brushConverter = new BrushConverter();
return new FormattedText(
text,
CultureInfo.CurrentCulture,
FlowDirection.LeftToRight,
new Typeface(new FontFamily("Microsoft YaHei"), FontStyles.Normal, FontWeights.UltraLight, FontStretches.Normal),
12, (Brush)brushConverter.ConvertFromString("#6E7079"))
{
MaxLineCount = 1,
TextAlignment = TextAlignment.Justify,
Trimming = TextTrimming.CharacterEllipsis
};
}
}
public static class SnapDrawingExtensions
{
public static void DrawSnappedLinesBetweenPoints(this DrawingContext dc,
Pen pen, double lineThickness, params Point[] points)
{
var guidelineSet = new GuidelineSet();
foreach (var point in points)
{
guidelineSet.GuidelinesX.Add(point.X);
guidelineSet.GuidelinesY.Add(point.Y);
}
var half = lineThickness / 2;
points = points.Select(p => new Point(p.X + half, p.Y + half)).ToArray();
dc.PushGuidelineSet(guidelineSet);
for (var i = 0; i < points.Length - 1; i = i + 2)
{
dc.DrawLine(pen, points[i], points[i + 1]);
}
dc.Pop();
}
}
}
如何换算出统计条占比如下:
二、创建BasicBarChartExample.xaml代码如下
<UserControl x:Class="WPFDevelopers.Samples.ExampleViews.BasicBarChartExample"

             xmlns="http://schemas.microsoft.com/winfx/2006/xaml/presentation"

             xmlns:x="http://schemas.microsoft.com/winfx/2006/xaml"

             xmlns:mc="http://schemas.openxmlformats.org/markup-compatibility/2006"

             xmlns:d="http://schemas.microsoft.com/expression/blend/2008"

             xmlns:local="clr-namespace:WPFDevelopers.Samples.ExampleViews"

             xmlns:wpfdev="https://github.com/yanjinhuagood/WPFDevelopers"

             mc:Ignorable="d"

             d:DesignHeight="450" d:DesignWidth="800">

    <Grid Background="Gainsboro">

        <Border

            Height="500"

            Background="White"

            Margin="30,0">

            <Grid Margin="20,10">

                <Grid.RowDefinitions>

                    <RowDefinition Height="40" />

                    <RowDefinition />

                    <RowDefinition Height="auto" />

                </Grid.RowDefinitions>

                <WrapPanel HorizontalAlignment="Right">

                    <Rectangle

                        Width="6"

                        Height="26"

                        Fill="Black" />

                    <TextBlock

                        Padding="10,0"

                        FontSize="24"

                        FontWeight="Black"

                        Text="{Binding KeyBarChart, RelativeSource={RelativeSource AncestorType=local:BasicBarChartExample}}" />

                </WrapPanel>

                <wpfdev:BasicBarChart

                     Grid.Row="1"

                    SeriesArray="{Binding SeriesModels, RelativeSource={RelativeSource AncestorType=local:BasicBarChartExample}}"/>

                <Button

                    Grid.Row="2"

                    Width="200"

                    VerticalAlignment="Bottom"

                    Click="Button_Click"

                    Content="刷新"

                    Style="{StaticResource PrimaryButton}" />

            </Grid>

        </Border>

    </Grid>

</UserControl>
三、创建BasicBarChartExample.xaml.cs代码如下
using System;

using System.Collections.Generic;

using System.Linq;

using System.Text;

using System.Windows;

using System.Windows.Controls;

using System.Windows.Data;

using System.Windows.Documents;

using System.Windows.Input;

using System.Windows.Media;

using System.Windows.Media.Imaging;

using System.Windows.Navigation;

using System.Windows.Shapes;

namespace WPFDevelopers.Samples.ExampleViews

{

    /// <summary>

    /// BasicBarChartExample.xaml 的交互逻辑

    /// </summary>

    public partial class BasicBarChartExample : UserControl

    {

        public IEnumerable<KeyValuePair<string, double>> SeriesModels

        {

            get { return (IEnumerable<KeyValuePair<string, double>>)GetValue(SeriesModelsProperty); }

            set { SetValue(SeriesModelsProperty, value); }

        }

        public static readonly DependencyProperty SeriesModelsProperty =

            DependencyProperty.Register("SeriesModels", typeof(IEnumerable<KeyValuePair<string, double>>), typeof(BasicBarChartExample), new PropertyMetadata(null));

        Dictionary<string, IEnumerable<KeyValuePair<string, double>>> keyValues = new Dictionary<string, IEnumerable<KeyValuePair<string, double>>>();

        public string KeyBarChart

        {

            get { return (string)GetValue(KeyBarChartProperty); }

            set { SetValue(KeyBarChartProperty, value); }

        }

        public static readonly DependencyProperty KeyBarChartProperty =

     DependencyProperty.Register("KeyBarChart", typeof(string), typeof(BasicBarChartExample), new PropertyMetadata(null));

        private int _index = 0;

        public BasicBarChartExample()

        {

            InitializeComponent();

            var Models1 = new[]

            {

                new KeyValuePair<string, double>("Mon", 120),

                new KeyValuePair<string, double>("Tue", 130),

                new KeyValuePair<string, double>("Wed", 160),

                new KeyValuePair<string, double>("Thu", 140),

                new KeyValuePair<string, double>("Fri", 200) ,

                new KeyValuePair<string, double>("Sat", 80) ,

                new KeyValuePair<string, double>("Sun", 90) ,

            };

            keyValues.Add("到访数", Models1);

            var Models2 = new[]

            {

                new KeyValuePair<string, double>("蛐蛐", 120),

                new KeyValuePair<string, double>("常威", 170),

                new KeyValuePair<string, double>("来福", 30),

                new KeyValuePair<string, double>("包龙星", 200),

                new KeyValuePair<string, double>("包有为", 100) ,

                new KeyValuePair<string, double>("雷豹", 180) ,

                new KeyValuePair<string, double>("方唐镜", 90) ,

            };

            keyValues.Add("能力值", Models2);

            SeriesModels = keyValues.ToList()[0].Value;

            KeyBarChart = keyValues.ToList()[0].Key;

        }

        private void Button_Click(object sender, RoutedEventArgs e)

        {

            _index++;

            if (_index >= keyValues.Count)

            {

                _index = 0;

            }

            SeriesModels = keyValues.ToList()[_index].Value;

            KeyBarChart = keyValues.ToList()[_index].Key;

        }

    }

}
效果预览
更多教程欢迎关注微信公众号:加微信群限时

微信群人数太多扫码进不来了,请添加个人微信邀请你(请标注理由)。(yanjinhuawechat)或(W_Feng_aiQ)
WPF开发者QQ群: 340500857
blogs: https://www.cnblogs.com/yanjinhua
源码Github:https://github.com/yanjinhuagood/WPFDevelopers.git
gitee:https://gitee.com/yanjinhua/WPFDevelopers.git
最新文章
- 制作一个顶部图片可以拉伸放大缩小效果的tableViewHeader
- 谷歌的网页排序算法(PageRank Algorithm)
- 【转载】为什么CPU有多层缓存
- Java多线程-新特性-有返回值的线程
- OSX 上初步尝试 asp.net 5
- LeetCode 263
- Spring Cloud Eureka Server 启停状态监控
- [转]33 useful Keyboard Shortcuts for Run commond
- 跟着刚哥梳理java知识点——IO(十五)
- 分布式改造剧集之Redis缓存采坑记
- os模块walk方法
- How does the vuejs add the query and walk the object?
- Java作业一 (2017-9-10)
- ajax 浏览网页等待页面
- 链表 c实现
- java操作mongodb(连接池)(转)
- 【知了堂学习笔记】java 正则表达式
- Android:你不知道的 WebView 使用漏洞
- 关于Unity中的光照(一)
- [C语言]日期间天数差值的计算