python 数据可视化---Anscombe’s quartet
2024-08-23 03:59:46
import seaborn as sns
sns.set(style="ticks")
# Load the example dataset for Anscombe's quartet
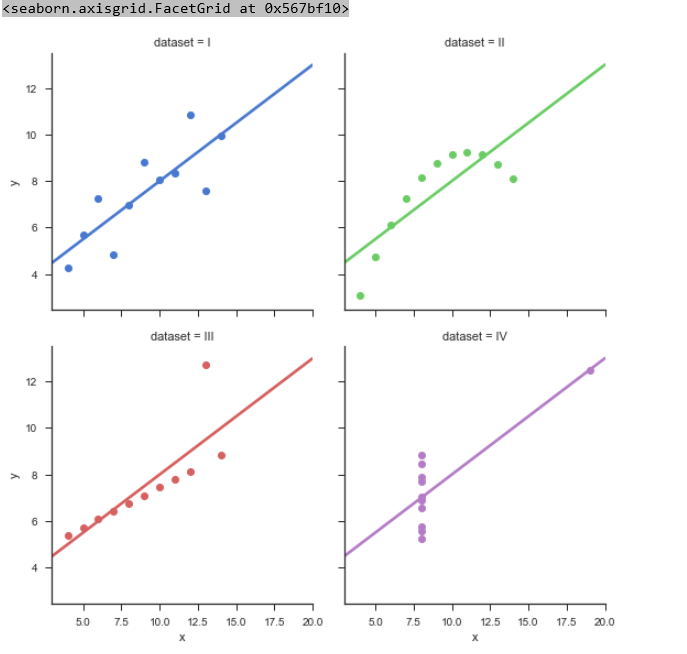
df = sns.load_dataset("anscombe")
# Show the results of a linear regression within each dataset
sns.lmplot(x="x", y="y", col="dataset", hue="dataset", data=df,
col_wrap=2, ci=None, palette="muted", size=4,
scatter_kws={"s": 50, "alpha": 1})
最新文章
- Java Swing interview
- ios客户端快速滚动和回弹效果的实现
- 【leetcode】 Unique Binary Search Trees II (middle)☆
- Java_动态加载类(英文)
- ArcEngine 异常:field is not editable
- 在FreeBSD上搭建Mac的文件及time machine备份服务
- SSO之CAS单点登录详细搭建教程
- 瞬间从IT屌丝变大神——CSS规范
- UVa 10054 The Necklace BFS+建模欧拉回路
- apache 2.4.9 配置其他客户端访问 required all granted
- uva 714 - Copying Books(贪心 最大值最小化 二分)
- webots自学笔记(一)软件界面和简单模型仿真
- 8. Andrénalin ★ Serial
- TCP/IP 协议 ----- 协议栈
- BZOJ 1257 - 余数之和 - [CQOI2007]
- 使用genism训练词向量【转载】
- javaScript--animate函数
- (转载)Unity UGUI点击不同Button执行不同的方法(无参方法)
- Zabbix系列之六——添加web监测
- SpringBoot(三)整合Redis