Method for Estimating the Number of Concurrent Users
1. Formula for Estimating the Average Number of Concurrent users
We begin by defining what the number of concurrent users means. But before we do, the term login session has to be clarified first.
A login session is a time interval defined by a start time and end time. Between the start time and end time, there are one or more system resources being held. Take any web application that requires user authentication as an example, a login session starts from the time the user logs on to the system and ends when the users logs out. A user session (which consumes system memory) is created for each login session. The length of a login session is the difference between the start time and the end time.
We are now ready to define the concept of concurrent users. We shall agree that the number of concurrent users at a particular time instant is defined as the number of login sessions into which the time instant falls. This is illustrated in the following example:
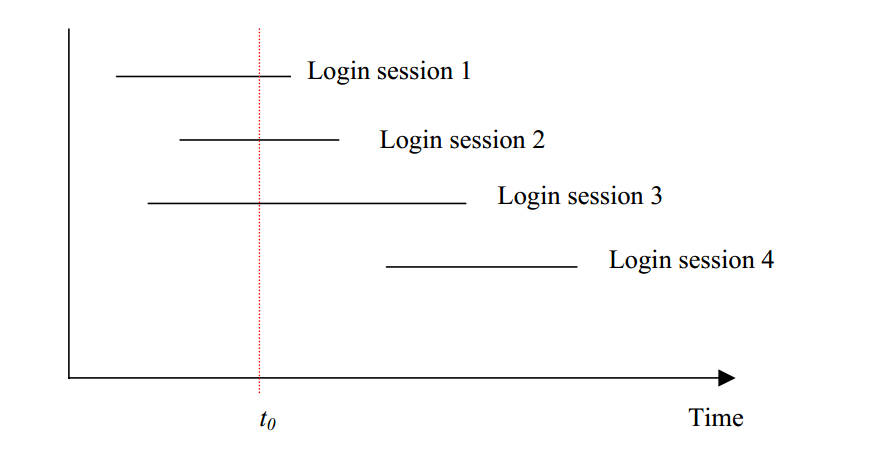
The horizontal axis is the time line. Each horizontal line segment represents a login session. Since the vertical line at time t0 intercepts with three login sessions, the number of concurrent users at time t0 is equal to three.
Let us focus on the time interval from 0 to an arbitrary time instant T. The following result can be mathematically proven:
Average number of concurrent users(C) = sum of the length of all login sesseions / T ...... (1)
Alternatively, if the total number of login sessions from time 0 to T equals n, and the average length of a login session equals L, then
C=nL/T ...... (2)
The formal proof is presented in the appendix. Intuitively, the formula can be shown this way: imagine that all the line segments representing the login sessions are joined end to end to form a long string. If the string is longer than T, then we have to wrap it round and round for a number of times in order to fill it in the space with length T. The number of times the string has to be wrapped is analogous to the average number of concurrent users. This is illustrated in the following figure:
2. Estimating the parameters
To calculate the average number of concurrent users (C) using the formula in section 3, a prerequisite is determining the values of the two parameters:
• the total number of login sessions (n)
• the average length of a login session (L)
in the time period of concern with length (T).
In this section, we give some advice about how these parameters could be estimated.
Firstly it should be pointed out that the result of the formula, C, is only an average value. It is possible that the number of concurrent users fluctuate widely in the concerned period of time. Hence, if we want the value of C to be as representative as possible, we should restrict the time period of concern so that the arrival rate of new login sessions (i.e. the ratio of n/T) is more or less steady in that time period. For example, if we know that a system is only used during office hours, we should limit the period of concern to the office hours only, instead of the whole day. The value of T is therefore equal to 8 (assuming 8-hour work) instead of 24. Otherwise, the value of C will be greatly dragged down by the fact that the system is not used during the non-officer hours.
The total number of login sessions (n) and the average length of a login session (L) can often be determined by the size of the user population and usage patterns. For example, if there are N potential users and we know that the probabilities that a user will use a system one time, two times and three times a day are p1, p2 and p3 respectively, and assume that a user will very unlikely use the system more than three times a day, then the total number of login sessions in one day is N(p1 + 2 p2 + 3 p3). On the other hand, the average length of a login session can be estimated by observing how a sample of users use the system.
In many systems, the frequency of usage and the average length of login sessions varies widely for different users. In this case, if we can group the users of similar usage patterns into a small number of classes, the above analysis can still be made. We can then calculate the number concurrent of users for each class and add the results together.
Undeniably, the usage patterns of users are often difficult to accurately predict. But for most systems, especially internal applications, some justifiable rough figures can usually be obtained. A example is presented in the next section to illustrate this.
3. An Example
The government of City H is going to launch the electronic payroll system for its 170,000 employees to view their own payroll information. Due to the varied levels of IT competency, the limited availability of PCs and the existence of other means for checking salary information, it is estimated that when the system is fully launched across the government, only 50% of the employees will regularly use the system. Of these users, it is also estimated that 70% will use the system once during the last week of each month. It was observed from the users who participated in the UAT that the average length of usage is about 5 minutes
We can now estimate the average concurrent number of users during the last week of a month. Let us restrict the period of concern to the office hours (9am – 5pm) of any one day.
n = 170,000 * 0.5 * 0.7 / 5 (assuming 5 days in a week)
= 11,900
L = 5 min
T = 8 hrs = 480 min ( 8 office hours each day)
C=nL/T = 11,900 * 5 / 480 = 124
So, it can be predicted that there will be an average of about 124 concurrent users accessing the system during the last week of each month
4. Estimating the Peak Number of Concurrent Users
 ...... (3)
C is the average number of the concurrent users.
4.1 In Practice
In the last section, we show that under the assumption that the arrival of new login sessions has a Poisson distribution, the peak number of concurrent users can be estimated. However, for many real world applications, the arrival of login sessions goes through the following states:
1. Sleeping state - during non-office hours there are no login sessions;
2. Transient state (rising) - the office hours start; people begin to login to the system; the rate of arrival of login sessions is increasing;
3. Steady state – the rate of arrival of login sessions becomes steady;
4. Transient state (falling) – the office hours is going to end; people are leaving the system; the rate of arrival of login sessions is decreasing;
State 4 is followed by state 1 and the cycle repeats.
For such applications, the assumption of section 6.1 is reasonable for state 3 only - that is, the steady state of the life cycle. Thus if we would like to more accurately predict the peak number of concurrent users, the following steps should be followed:
1. Estimate the time period of the steady state from experience.
2. Estimate the number of login sessions in the steady state.
3. Calculate the average number of concurrent users C using formula (2) of section 3.
4. Apply the formula (3) in section 6.1 to calculate the peak number of concurrent users.
The above steps are illustrated with the example in section 5 again as follows:
As a continuation of the example, assume further that 80% of users access the payroll system during the 5 hours period from 9:30am to 12:30am and 2:30pm to 4:30pm, despite the 8-hour working day. Also, the arrival of new login sessions is steady in these periods.
T = 5 hrs = 300 min
n = 11,900 * 0.8 = 9,520
L = 5 min
C = nL/T = 9520*5/300 = 159
 = 196
= 196
The reader may note that there is a discrepancy between the average number concurrent users calculated in section 5, and the average value calculated just above. In fact both of them are valid figures. This exemplifies what has been said in the beginning of section 4, that is, the average value of concurrent users can be very much dependent on the time period of concern. In section 5, our time period of concern is the whole working hours, so the average value is dragged down by the transient periods when there are few people using the system. In this section, we restrict the time period of concern to the peak hours only, so the value is larger. Although both values are valid, the latter figure is probably a better representation of the usage of the system.
最新文章
- RISC指令集的五个周期
- 可以结合react的ui组件
- Android实用代码七段(五)
- 如何分析解读systemstat dump产生的trc文件
- 抛开react,如何理解virtual dom和immutability
- KMP---Count the string
- [转载]Soap安全测试入门
- JavaWeb项目开发案例精粹-第4章博客网站系统-006View层
- C#.Net中的非托管代码清理
- SQL Server 2008空间数据应用系列十:使用存储过程生成GeoRSS聚合空间信息
- PhoneGap或者Cordova框架下实现Html5中JS调用Android原生代码
- 使用LIBUSB实现和自定义通讯设备通讯--MFC代码在末尾
- list.add(),向List集合插入对象报空指针异常
- 列表(list)之二 -运用篇 -快速生成规律性列表
- BZOJ4424: Cf19E Fairy
- Webapi--Webapi 跨域链接
- python文件夹copy器(多进程版)
- LOJ.6068.[2017山东一轮集训Day4]棋盘(费用流zkw)
- Javascript--数组转换成字符串
- Windows下tomcat启动一闪而过