ELK平台搭建(下)
1. 目的
为指导在Centos6.8系统下搭建标准ELK平台的工作,特编写本施工文档。
2. 定义
Elasticsearch Logstash Kibana结合Redis协同工作。
3. 适用范围
适用于运营维护组运维工程师,针对在系统Centos6.8下搭建标准ELK平台的工作。
4. 环境
|
Elasticsearch |
Elasticsearch+filebeat |
filebeat |
filebeat |
Elasticsearch++Redis+Kibana+filebeat+logstash_server |
|
|
操作系统 |
CentOS 6.8 x64 |
CentOS 6.8 x64 |
CentOS 6.8 x64 |
CentOS 6.8 x64 |
CentOS 6.8 x64 |
|
CPU/内存 |
双8核cpu/32G |
双8核cpu/32G |
双8核cpu/16G |
双8核cpu/16G |
双8核cpu/64G |
|
外网IP |
115.182.45.39 |
||||
|
内网IP |
192.168.0.15 |
192.168.0.16 |
192.168.0.17 |
192.168.0.18 |
192.168.0.19 |
|
Elasticsearch版本 |
elasticsearch-5.4.1.tar.gz |
||||
|
Logstash版本 |
logstash-5.4.1.tar.gz |
||||
|
Kibana版本 |
kibana-5.4.1-linux-x86_64.tar.gz |
||||
|
Redis版本 |
redis-3.0.7 |
||||
|
JDK版本 |
jdk-8u144-linux-x64 |
5. 施工前准备
准备如下安装包:
wget https://artifacts.elastic.co/downloads/elasticsearch/elasticsearch-5.4.1.tar.gz
wget https://artifacts.elastic.co/downloads/kibana/kibana-5.4.1-linux-x86_64.tar.gz
wget https://artifacts.elastic.co/downloads/logstash/logstash-5.4.1.tar.gz
wget https://artifacts.elastic.co/downloads/beats/filebeat/filebeat-5.4.1-linux-x86_64.tar.gz
http://download.redis.io/releases/redis-3.0.7.tar.gz
6. 施工过程
6.1 安装java环境
在五台服务器上分别安装jdk-8u144-linux-x64
#mkdir -p /usr/java
#tar -xzvf jdk-8u144-linux-x64.tar.gz -C /usr/java
#vim /etc/profile
增添以下内容:
export JAVA_HOME=/usr/java/jdk1.8.0_144
export JRE_HOME=${JAVA_HOME}/jre
export CLASSPATH=.:${JAVA_HOME}/lib:${JRE_HOME}/lib
export PATH=${JAVA_HOME}/bin:$PATH
# source /etc/profile
# java -version
java version "1.8.0_144"
Java(TM) SE Runtime Environment (build 1.8.0_144-b01)
Java HotSpot(TM) 64-Bit Server VM (build 25.144-b01, mixed mode)
6.2 安装logstash
6.2.1 解压logstash源码包
在192.168.0.19服务器上解压logstash
# tar -xzvf logstash-2.3.4.tar.gz -C /data/soft/
6.2.1 创建config
创建config目录
# mkdir -p /data/soft/logstash-5.4.1/conf/
6.3 安装 redis
6.2.1 在192.168.0.19上安装redis
#yum install gcc gcc-c++ -y #安装过的,就不需要再安装了
#wget http://download.redis.io/releases/redis-3.0.7.tar.gz
#tar xf redis-3.0.7.tar.gz
#cd redis-3.0.7
#make
#mkdir -p /usr/local/redis/{conf,bin}
#cp ./*.conf /usr/local/redis/conf/
#cp runtest* /usr/local/redis/
#cd utils/
#cp mkrelease.sh /usr/local/redis/bin/
#cd ../src
#cp redis-benchmark redis-check-aof redis-check-dump redis-cli redis-sentinel redis-server redis-trib.rb /usr/local/redis/bin/
创建redis数据存储目录
#mkdir -pv /data/redis/db
#mkdir -pv /data/log/redis
6.2.2 修改redis配置文件
#cd /usr/local/redis/conf
#vi redis.conf
dir ./ 修改为dir /data/redis/db/
保存退出
Redis在性能上的优化:
#vim /usr/local/redis/conf/redis.conf
maxmemory 6291456000
6.2.3 启动redis
#nohup /usr/local/redis/bin/redis-server /usr/local/redis/conf/redis.conf &
6.2.4 查看redis进程
#ps -ef | grep redis
root 4425 1149 0 16:21 pts/0 00:00:00 /usr/local/redis/bin/redis-server *:6379
root 4435 1149 0 16:22 pts/0 00:00:00 grep redis
#netstat -tunlp
Active Internet connections (only servers)
Proto Recv-Q Send-Q Local Address Foreign Address State PID/Program name
tcp 0 0 0.0.0.0:22 0.0.0.0:* LISTEN 1402/sshd
tcp 0 0 127.0.0.1:25 0.0.0.0:* LISTEN 1103/master
tcp 0 0 0.0.0.0:6379 0.0.0.0:* LISTEN 4425/redis-server *
tcp 0 0 :::22 :::* LISTEN 1402/sshd
tcp 0 0 ::1:25 :::* LISTEN 1103/master
tcp 0 0 :::6379 :::* LISTEN 4425/redis-server *
6.3配置使用filebeat
6.3.1 在192.168.0.16上收集/data/soft/tomcat-user/logs/catalina.out日志
# vim /newnet.bak/elk/filebeat-5.4.1-linux-x86_64/filebeat.yml (修改)
- input_type: log
paths:
- /data/soft/tomcat-user/logs/catalina.out
tags: ["tomcat-user"]
output.redis:
# Array of hosts to connect to.
hosts: ["192.168.0.19:6379"]
key: "tomcat-user-log"
db: 7
timeout: 5
template.enabled: true
template.path: "filebeat.template.json"
template.overwrite: false
此配置文件意思是要将该路径下产生的日志输送到redis当中,其中type 和 key是自己定义的类型,方便识别。
6.3.2 启动filebeat
nohup /newnet.bak/elk/filebeat-5.4.1-linux-x86_64/filebeat -c filebeat.yml &
#ps -ef |grep filebeat #检验启动成功
6.4安装elasticsearch
在三台服务器 192.168.0.15、192.168.0.16、192.168.0.19上分别安装elasticsearch。例如在192.168.0.15上安装elasticsearch
6.4.1 添加elasticsearch用户,因为Elasticsearch服务器启动的时候,需要在普通用户权限下来启动。
#adduser elasticsearch
#passwd elasticsearch
# tar -xzvf elasticsearch-5.4.1.tar.gz -C /home/elasticsearch/
直接将包拷贝至/home/elasticsearch时候无法修改配置文件,因此需要修改权限;
#chmod 777 /home/elasticsearch -R
#chown elasticsearch.elasticsearch /home/elasticsearch -R
#su - elasticsearch
6.4.2 修改elasticsearch 配置文件
# cd elasticsearch-5.4.1
#mkdir {data,logs}
# cd config
#vim elasticsearch.yml
cluster.name: serverlog #集群名称,可以自定义
node.name: node-1 #节点名称,也可以自定义
path.data: /home/elasticsearch/elasticsearch-5.4.1/data #data存储路径
path.logs: /home/elasticsearch/elasticsearch-5.4.1/logs #log存储路径
network.host: 192.168.0.15 #节点ip
http.port: 9200 #节点端口
discovery.zen.ping.unicast.hosts: ["192.168.0.16","192.168.0.19"] #集群ip列表
discovery.zen.minimum_master_nodes: 3 #集群节点数
6.4.3 启动服务
#cd elasticsearch-5.4.1
#./bin/elasticsearch -d
查看进程
出现的常见错误分析:
错误1:max file descriptors [4096] for elasticsearch process is too low, increase to at least [65536]
解决:打开/etc/security/limits.conf文件,添加以下两行代码并保存:
* soft nofile 65536 //*表示任意用户,这里是elasticsearch报的错,也可以直接填运行elasticsearch的用户;
* hard nofile 131072
错误2:memory locking requested for elasticsearch process but memory is not locked
解决:修改elasticsearch.yml文件
bootstrap.memory_lock : false
错误3:max virtual memory areas vm.max_map_count [65530] is too low, increase to at least [262144]
解决:修改内核配置
#sysctl -w vm.max_map_count=262144
# sysctl -p
错误4:os::commit_memory(0x00000001006cd000, 77824, 0) failed; error=’Cannot allocate memory’ (errno=12)
解决:提供内存不足,增大主机内存或减小elasticsearch的内存大小
# vim /newnet.bak/elk/elasticsearch-5.4.1/config/jvm.options
-Xms4g
-Xmx4g
#ps -ef | grep elasticsearch
查看端口
#netstat -tunlp
(Not all processes could be identified, non-owned process info
will not be shown, you would have to be root to see it all.)
Active Internet connections (only servers)
Proto Recv-Q Send-Q Local Address Foreign Address State PID/Program name
tcp 0 0 0.0.0.0:22 0.0.0.0:* LISTEN -
tcp 0 0 127.0.0.1:25 0.0.0.0:* LISTEN -
tcp 0 0 ::ffff:10.0.18.148:9300 :::* LISTEN 1592/java
tcp 0 0 :::22 :::* LISTEN -
tcp 0 0 ::1:25 :::* LISTEN -
tcp 0 0 ::ffff:10.0.18.148:9200 :::* LISTEN
启动连个端口:9200集群之间事务通信,9300集群之间选举通信,其余两台elasticsearch服务根据这台服务的配置文件做相应调整。
6.4.4 等待三台elasticsearch做好后,查看集群健康信息
# curl -XGET 'http://192.168.0.19:9200/_cluster/health?pretty'
{
"cluster_name" : "serverlog",
"status" : "green",
"timed_out" : false,
"number_of_nodes" : 3,
"number_of_data_nodes" : 3,
"active_primary_shards" : 105,
"active_shards" : 210,
"relocating_shards" : 0,
"initializing_shards" : 0,
"unassigned_shards" : 0,
"delayed_unassigned_shards" : 0,
"number_of_pending_tasks" : 0,
"number_of_in_flight_fetch" : 0,
"task_max_waiting_in_queue_millis" : 0,
"active_shards_percent_as_number" : 100.0
}
6.4.5 查看节点数
# curl -XGET 'http://192.168.0.15:9200/_cat/nodes?v'
host ip heap.percent ram.percent load node.role master name
192.168.0.15 192.168.0.15 27 28 0.10 d * node-1
192.168.0.19 192.168.0.19 20 100 6.03 d m node-3
192.168.0.17 192.168.0.17 30 87 0.17 d m node-2
注意:*表示当前master节点
6.4.6 查看节点分片的信息
#curl -XGET 'http://192.168.0.19:9200/_cat/indices?v'
health status index pri rep docs.count docs.deleted store.size pri.store.size
6.4.7 在三台Elasticsearch节点上安装x-pack插件,如下:
x-pack是elasticsearch的一个扩展包,将安全,警告,监视,图形和报告功能捆绑在一个易于安装的软件包中,虽然x-pack被设计为一个无缝的工作,但是你可以轻松的启用或者关闭一些功能。
#su - elasticsearch
#cd elasticsearch-5.4.1
#./bin/plugin install x-pack #x-pack插件
注意:如果只有一台外网的话可以现在这台上面下载好这个插件,然后拷贝到其余两台,但是x-pack不能拷贝到kibana,不一样的环境。
6.5 配置使用logstash_server
6.5.1 在192.168.0.19 上
#cd /data/soft/logstash-5.4.1/conf
# mkdir -p {16..19}.config
#cd 16.config
#vim logstash_server.conf
input {
redis {
port => "6379"
host => "192.168.0.19"
db => "7"
data_type => "list"
key => "tomcat-user-log"
}
output {
if "nginx-access" in [tags] {
elasticsearch {
codec => "json"
hosts => ["192.168.0.15:9200","192.168.0.16:9200","192.168.0.19:9200"]
user => "elastic"
password => "changeme"
manage_template => true
index => "192.168.0.19-nginx-access-log-%{+YYYY.MM.dd}"
}
}
}
里面的key与type 与filebeat 中的配置要相互匹配。
在性能上为了优化调优参数:
#vim /newnet.bak/elk/logstash-5.4.1/config/logstash.yml
pipeline.batch.size: 10000
pipeline.workers: 8
pipeline.output.workers: 8
pipeline.batch.delay: 10
6.5.2 启动logstash_server
#/data/soft/logstash-5.4.1/bin/logstash -f /data/soft/logstash-5.4.1/
conf/16.config/logstash_server.conf --configtest
#/data/soft/logstash-5.4.1/bin/logstash -f /data/soft/logstash-5.4.1/
conf/16.config/logstash_server.conf
# ps -ef |grep logstash
检测logstash是否启动;
6.6 安装配置kibana
6.6.1 在192.168.0.19上安装kibana
# tar -xzvf kibana-5.4.1-linux-x86_64.tar.gz -C /data/soft/
6.6.2 安装插件
#cd /data/soft/kibana-4.6.1-linux-x86_64/bin/kibana
#./kibana plugin --install x-pack
6.6.3 修改kibana配置文件
#cd /data/soft/kibana-4.6.1-linux-x86_64/config
#vim kibana.yml
server.port: 5601
server.host: "0.0.0.0"
elasticsearch.username: "elastic"
elasticsearch.password: "changeme"
elasticsearch.url: "http://192.168.0.19:9200"
6.6.4 启动kibana
# nohup bin/kibana &
然后命令行输入exit
# netstat -anput |grep 5601
4.施工后校验
7.1 在浏览器访问kibana端口并创建index,如下:
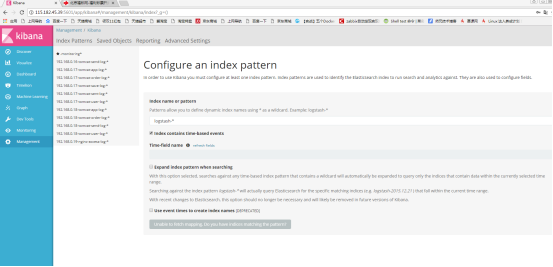
红方框中的索引名称是我在logstash server 服务器的配置文件中配置的index名称
点击绿色按钮“Create”,就可以创建成功了!然后查看kibana界面的“Discovery”,
可以看到已经搜集到日志数据了!
7.2 查看node,查看集群是否一致
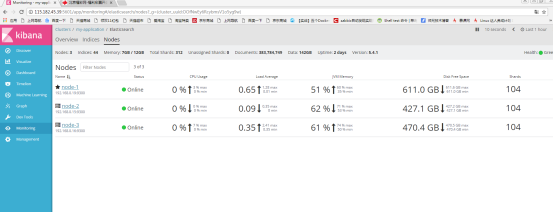
上图中也标记了node-1为master节点(有星星标记),上图显示的数据是不断刷新的,上面提到了查看节点分片的信息。
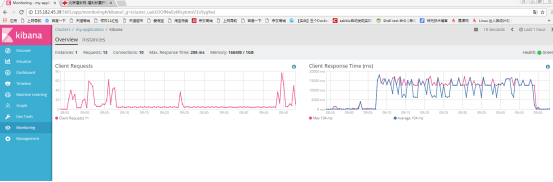
7.3 查看吞吐量

7.6 节点分片信息相关的问题
在本次实验的过程中,第一次查看分片信息是没有的,因为没有创建索引,后面等创建过索引之后,就可以看到创建的索引信息了,但是还有集群的信息没有显示出来,问题应该和第2个一样,Elasticsearch有问题,重启之后,就查看到了如下:
# curl -XGET '192.168.0.19:9200/_cat/indices?v'
health status index pri rep docs.count docs.deleted store.size pri.store.size
green open 192.168.0.18-tomcat-send-log-2017.12.20 5 1 650297 0 165.4mb 82.6mb
green open 192.168.0.16-log-2017.12.20 5 1 3800 0 1.4mb 762kb
green open 192.168.0.17-tomcat-order-log-2017.12.20 5 1 905074 0 274.9mb 137.4mb
green open 192.168.0.17-tomcat-order-log-2017.12.21 5 1 7169 0 2.5mb 1.2mb
green open 192.168.0.19-nginx-log-2017.12.20 5 1 525427 0 231.4mb 115.6mb
green open 192.168.0.19-nginx-log-2017.12.21 5 1 315 0 421.6kb 207.2kb
7.7 关于创建多个index索引名称,存储不同类型日志的情况
也许我们不止tomcat-send这一种日志需要搜集分析,还有httpd、nginx、mysql等日志,但是如果都搜集在一个索引下面,会很乱,不易于排查问题,如果每一种类型的日志都创建一个索引,这样分类创建索引,会比较直观,实现是在logstash server 服务器上创建配置文件,然后启动,如下:
input {
redis {
port => "6379"
host => "192.168.0.19"
db => "5"
data_type => "list"
key => "tomcat-send-log"
}
redis {
port => "6379"
host => "192.168.0.19"
db => "9"
data_type => "list"
key => "nginx-access-log"
}
redis {
port => "6379"
host => "192.168.0.19"
db => "7"
data_type => "list"
key => "tomcat-user-log"
}
redis {
port => "6379"
host => "192.168.0.19"
db => "8"
data_type => "list"
key => "tomcat-order-log"
}
redis {
port => "6379"
host => "192.168.0.19"
db => "7"
data_type => "list"
key => "tomcat-app-log"
}
redis {
port => "6379"
host => "192.168.0.19"
db => "7"
data_type => "list"
key => "tomcat-orderr-log"
}
}
filter {
if "nginx-access" in [tags] {
geoip {
source => "remote_addr"
target => "geoip"
database =>"/data/soft/logstash-5.4.1/etc/GeoLite2-City .mmdb"
add_field => [ "[geoip][coordinates]", "%{[geoip][longitude]}" ]
add_field => [ "[geoip][coordinates]", "%{[geoip][latitude]}" ]
}
mutate {
convert => [ "[geoip][coordinates]", "float"]
}
}
}
output {
if "nginx-access" in [tags] {
elasticsearch {
codec => "json"
hosts => ["192.168.0.15:9200","192.168.0.16:9200","192.168.0.19:9200"]
user => "elastic"
password => "changeme"
manage_template => true
index => "192.168.0.19-nginx-access-log-%{+YYYY.MM.dd}"
}
}
else if "tomcat-send" in [tags] {
elasticsearch {
codec => "json"
hosts => ["192.168.0.15:9200","192.168.0.16:9200","192.168.0.19:9200"]
user => "elastic"
password => "changeme"
manage_template => true
index => "192.168.0.16-tomcat-send-log-%{+YYYY.MM.dd}"
}
}
else if "tomcat-user" in [tags] {
elasticsearch {
codec => "json"
hosts => ["192.168.0.15:9200","192.168.0.16:9200","192.168.0.19:9200"]
user => "elastic"
password => "changeme"
manage_template => true
index => "192.168.0.17-tomcat-user-log-%{+YYYY.MM.dd}"
}
}
再对应的日志服务器(称为客户端)本身配置conf文件,如下:
- input_type: log
# Paths that should be crawled and fetched. Glob based paths.
paths:
- /data/soft/tomcat-user/logs/catalina.out
tags: ["tomcat-user"]
- input_type: log
paths:
- /data/soft/tomcat-app/logs/catalina.out
tags: ["tomcat-app"]
- input_type: log
paths:
- /data/soft/tomcat-order/logs/catalina.out
tags: ["tomcat-orderr"]
- input_type: log
paths:
- /data/soft/tomcat-sent/logs/catalina.out
tags: ["tomcat-sent"]
- input_type: log
paths:
- /data/soft/tomcat-save/logs/catalina.out
tags: ["tomcat-save"]
output.redis:
# Array of hosts to connect to.
hosts: ["192.168.0.19:6379"]
key: "tomcat-user-log"
db: 7
timeout: 5
output.redis:
hosts: ["192.168.0.19:6379"]
key: "tomcat-app-log"
db: 7
timeout: 5
output.redis:
hosts: ["192.168.0.19:6379"]
key: "tomcat-orderr-log"
db: 7
timeout: 5
output.redis:
hosts: ["192.168.0.19:6379"]
key: "tomcat-sent-log"
db: 7
timeout: 5
output.redis:
hosts: ["192.168.0.19:6379"]
key: "tomcat-save-log"
db: 7
timeout: 5
# Optional protocol and basic auth credentials.
#protocol: "https"
#username: "elastic"
#password: "changeme"
template.enabled: true
template.path: "filebeat.template.json"
template.overwrite: false
8. 参考文献
主要参考两篇技术博客:
http://blog.51cto.com/467754239/1700828
http://blog.51cto.com/linuxg/1843114
最新文章
- 关于 Xcode8打印JSON的时候,NSLog控制台显示不完整
- 使用 ServiceStack 构建跨平台 Web 服务
- Spring源码分析——BeanFactory体系之接口详细分析
- 响应式图片srcset学习
- 使用 桌面的 chrome 远程调试 Android 的页面
- 基于visual Studio2013解决面试题之0609寻找链表公共节点
- Android项目---LayoutParams
- (23)IO之打印流 PrintStream & Printwriter
- linux ubuntu系统下MySQL的安装及设置
- ANOVA (paper from the onlinestat)
- Oracle中保留两位小数
- Win7无法安装程序提示Installer integrity check has failed的解决方法
- docker 的前台模式和后台模式
- jstat 详解
- 5. 支持向量机(SVM)软间隔
- 用css3实现社交分享按钮
- whlie and for
- 700. Search in a Binary Search Tree
- 使用Jenkins和Jmeter搭建性能测试平台
- 【BZOJ5100】[POI2018]Plan metra 构造