D3.js系列——布局:打包图和地图
一、打包图
打包图( Pack ),用于表示包含与被包含的关系,也可表示各对象的权重,通常用一圆套一圆来表示前者,用圆的大小来表示后者。
1、布局(数据转换)
var pack = d3.layout.pack()

            .size([ width, height ])

            .radius();
第 1 行:打包图的布局
第 2 行:size() 设定转换的范围,即转换后顶点的坐标(x,y),都会在此范围内。
第 3 行:radius() 设定转换后最小的圆的半径。
读取数据并转换的代码
d3.json("city2.json", function(error, root) {

        var nodes = pack.nodes(root);

        var links = pack.links(nodes);

        console.log(nodes);

        console.log(links);

}
上面用 pack 函数分别将数据转换成了顶点 nodes 和 连线 links。来看看顶点数据被转换成了什么样:
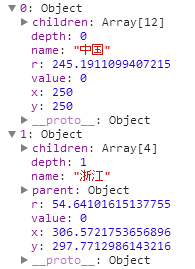
数据被转换后,多了深度信息(depth),半径大小(r),坐标位置(x,y)等。打包图无需对连线进行绘制。
注意:无论用什么 Layout 来转换数据,一定要先看转换后的数据是什么再绘制,否则很容易出错。
2、绘制
绘制的内容有圆和文字,都在 SVG 中绘制。实例代码如下:
<!DOCTYPE html>

<html lang="en">

<head>

  <meta charset="UTF-8">

  <meta name="viewport" content="width=device-width, initial-scale=1.0">

  <meta http-equiv="X-UA-Compatible" content="ie=edge">

  <title>vue生命周期学习</title>

  <script src="d3.min.js"></script>

</head>

<body>

</body>

<script>

//准备画布

var width=,height=;

var svg = d3.select("body").append("svg").attr("width",width).attr("height",height);

//布局

var pack = d3.layout.pack().size([width,height]).radius();

//读取数据并转换数据

d3.json('city2.json',function(error,root){

    var nodes = pack.nodes(root);

    var links = pack.links(nodes);

    console.log(nodes,links);

    //画圆

    svg.selectAll("circle")

    .data(nodes)

    .enter()

    .append("circle")

    .attr("fill","rgb(31, 119, 180)")

    .attr("fill-opacity","0.4")

    .attr("cx",function(d){

        return d.x;

    })

    .attr("cy",function(d){

        return d.y;

    })

    .attr("r",function(d){

        return d.r;

    })

    .on("mouseover",function(d,i){

        d3.select(this).attr("fill","yellow")

    })

    .on("mouseout",function(d,i){

        d3.select(this).attr("fill","rgb(31, 119, 180)");

    });

    //给文本

    svg.selectAll("text")

    .data(nodes)

    .enter()

    .append("text")

    .attr("font-size","10px")

    .attr("fill","white")

    .attr("fill-opacity",function(d){

        if(d.depth == )

            return "0.9";

        else

            return "";

    })

    .attr("x",function(d){ return d.x; })

    .attr("y",function(d){ return d.y; })

    .attr("dx",-)

    .attr("dy",)

    .text(function(d){ return d.name; });

})

</script>

</html>
二、地图
在数据可视化中,地图是很重要的一部分。很多情况会与地图有关联,如中国各省的人口多少,GDP多少等,都可以和地图联系在一起。
将 JSON 的格式应用于地理上的文件,叫做 GeoJSON 文件。本文就是用这种文件绘制地图。
1、投影函数
var projection = d3.geo.mercator()

    .center([, ])

    .scale()

    .translate([width/, height/]);
由于 GeoJSON 文件中的地图数据,都是经度和纬度的信息。它们都是三维的,而要在网页上显示的是二维的,所以要设定一个投影函数来转换经度纬度。如上所示,使用 d3.geo.mercator() 的投影方式。
第 2 行:center() 设定地图的中心位置,[107,31] 指的是经度和纬度。
第 3 行:scale() 设定放大的比例。
第 4 行:translate() 设定平移。
2、地理路径生成器
为了根据地图的地理数据生成 SVG 中 path 元素的路径值,需要用到 d3.geo.path(),我称它为地理路径生成器
var path = d3.geo.path()

    .projection(projection);
projection() 是设定生成器的投影函数,把上面定义的投影传入即可。以后,当使用此生成器计算路径时,会自己加入投影的影响。
3、向服务器请求文件并绘制地图
<html>

  <head>

        <meta charset="utf-8">

        <title>中国地图</title>

  </head>

<body>

<script src="http://d3js.org/d3.v3.min.js"></script>

<script>

    var width  = ;

    var height = ;

    var svg = d3.select("body").append("svg")

        .attr("width", width)

        .attr("height", height)

        .append("g")

        .attr("transform", "translate(0,0)");

    var projection = d3.geo.mercator()

                        .center([, ])

                        .scale()

                        .translate([width/, height/]);

    var path = d3.geo.path()

                    .projection(projection);

    var color = d3.scale.category20();

    d3.json("china.geojson", function(error, root) {

        if (error)

            return console.error(error);

        console.log(root.features);

        svg.selectAll("path")

            .data( root.features )

            .enter()

            .append("path")

            .attr("stroke","#000")

            .attr("stroke-width",)

            .attr("fill", function(d,i){

                return color(i);

            })

            .attr("d", path )

            .on("mouseover",function(d,i){

                d3.select(this)

                    .attr("fill","yellow");

            })

            .on("mouseout",function(d,i){

                d3.select(this)

                    .attr("fill",color(i));

            });

    });

</script>

</body>

</html>
再次声明:d3.json() 不能直接读取本地文件,因此你需要搭建一个服务器,例如 Apache。但是在火狐浏览器是可以直接读取的。
接下来,就是给 svg 中添加 path 元素。本例中,每一个 path 表示一个省。要注意 attr(“d”,path) 这一行代码,它相当于:
.attr("d",funtion(d){

    return path(d);

})
最新文章
- Spring Aspectj切入点语法定义
- 原!! java直接打印一个对象时,并不是直接调用该类的toString方法 ,而是会先判断是否为null,非null才会调用toString方法
- PHP操作MongoDB简明教程(转)
- 详解VB.net编写DLL(动态链接库、应用程序扩展)文件
- [C#参考]UI和线程(一)
- 数据结构——二叉树(Binary Trees)
- 【模板】Dijkstra的heap优化
- [WPF]本地化入门
- 基于QT的异质链表实例
- EJB通过ANT提高EJB应用的开发效率、开发具有本地接口的无状态bean、开发有状态bean
- POJ_3342_Party at Hali-Bula_树形DP
- uboot中的中断macro宏
- java 根据经纬度坐标计算两点的距离算法
- Python练习:爬取图片
- Dynamics CRM On-Premise V9安装手记
- CSS3背景相关新增属性
- JavaScript中的BOM和DOM
- 一文读懂 深度强化学习算法 A3C (Actor-Critic Algorithm)
- 只想写一个真正能用的django mock
- jQuery事件篇---基础事件