[Python Study Notes]水平柱状图绘制
2024-09-28 09:27:09
'''''''''''''''''''''''''''''''''''''''''''''''''''''''''''''''''''''''''''''''''''''''''''''''''''
>>文件: 水平直方图.py
>>作者: liu yang
>>邮箱: liuyang0001@outlook.com
>>博客: www.cnblogs.com/liu66blog ''''''''''''''''''''''''''''''''''''''''''''''''''''''''''''''''''''''''''''''''''''''''''''''''''' #!/usr/bin/env python
# -*- coding: utf-8 -*- import sys, os
import matplotlib
import matplotlib.pyplot as plt
# 定义要使用的字体,防止出现中文乱码
font=matplotlib.font_manager.FontProperties(fname=r"C:\Windows\Fonts\Deng.ttf") # Horizontal histogram 水平直方图
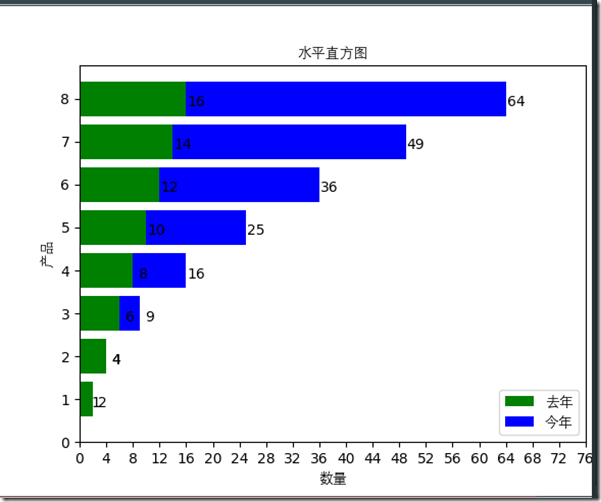
def horizontal_histogram():
# 先生成一个画布
fig = plt.figure()
# 生成数据
x1 = [x for x in range(1, 9)]
y1 = [n * 2 for n in range(1, 9)]
x2 = [x for x in range(1, 9)]
y2 = [x ** 2 for x in x2]
# 画水平直方图
l2=plt.barh(x2,y2,color='b')
l1=plt.barh(x1,y1,color='g')
# 设置
plt.title("水平直方图",fontproperties=font)
# 设置x,y轴标签
plt.xlabel('数量',fontproperties=font)
plt.ylabel('产品',fontproperties=font)
# 设置刻度
plt.xticks([x for x in range(0,80,4)])
plt.yticks([y for y in range(0,9,1)])
# 设置注解狂图示
plt.legend(handles = [l1, l2,], labels = ['去年', '今年'], loc = 'best',prop=font)
for x1,x2, y1, y2 in zip(x1,x2, y1, y2):
# 添加文本时添加偏移量使其显示更加美观
plt.text(y1+1.5 , x1-0.25, '%.0f' % y1, ha='center', va='bottom')
plt.text(y2+1.5 , x2-0.25, '%.0f' % y2, ha='center', va='bottom')
# 显示
plt.show()
if __name__ == '__main__':
histogram = horizontal_histogram()
最新文章
- [CareerCup] 18.7 Longest Word 最长的单词
- 配置RAC到单节点standby的data guard
- LeetCode Implement Queue using Stacks (数据结构)
- linux 多网卡 跃点数
- php下载文件,添加响应头
- Word分栏
- Ajax 整理总结(进阶)
- 关于C51中“大小端存储”问题的详解
- Android SQLite总结
- HDU 1724 Ellipse
- javaweb聊天室源码免费
- js选中变色,不选中鼠标放上变色
- SQLServer数据库
- 南昌邀请赛I.Max answer 单调栈+线段树
- Web前端开发必备
- BZOJ 3612: [Heoi2014]平衡
- linux每日命令(24):Linux 目录结构
- date.getTime()
- 《CDN 之我见》原理篇——CDN的由来与调度
- 如何设置Eclipse工作区默认编辑宽度