Jmeter之性能测试插件PerfMon Metrics Collector监听器,实时监听服务器资源(十四)
|
Servers Performance Monitoring |
Introduction
During a load test, it is important to know the health of the servers loaded. It is also nice to see if you are targeting a cluster if the load is correctly dispatched. To address this, the plugin package now supports server monitoring! Using it, you can monitor CPU, Memory, Swap, Disks I/O and Networks I/O on almost all platforms!
Here is how the plugin looks like. It shows the CPU usage of 4 servers involved in the load test:

Metrics Collected
Since version 0.5.0 the Server Agent tool supports collecting over 75 system metrics. See full list.
How it works
Concept
JMeter cannot retrieve by default server metrics except Tomcat ones. To overcome this situation, we have developed a server agent which will get performance data for JMeter. The agent uses the SIGAR open source library. It is composed of a Java common part and native libraries per OS.

Usage
GUI Mode
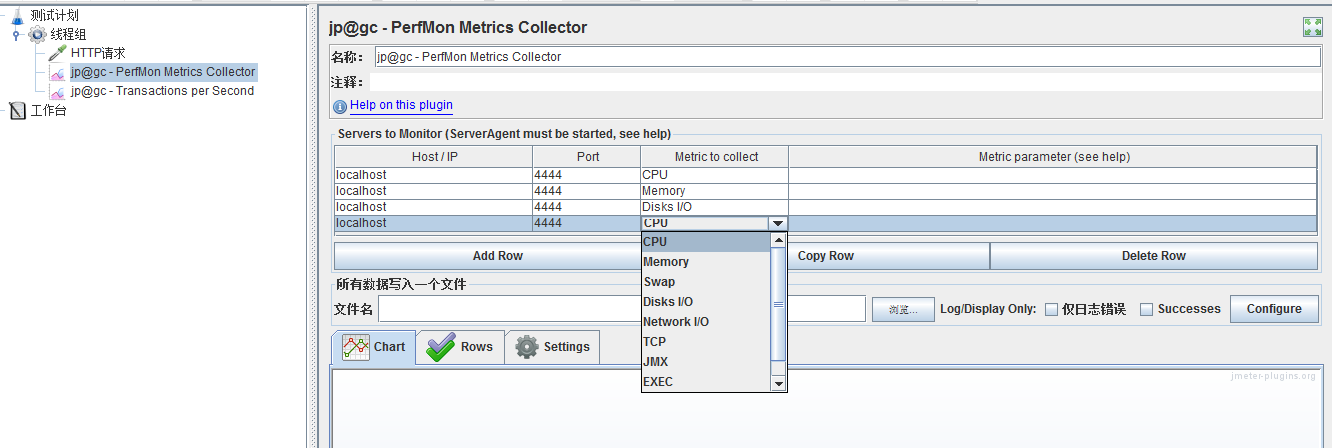
In GUI mode, just add the listener, define servers and metric types to monitor, ensure the agent is running at remote server and is not blocked by a firewall, then run the test. The values will be displayed at real time chart.
Non GUI Mode

If you run JMeter in non GUI mode and want to save monitoring data to file, just configure result file saving in GUI as you do with other listeners. After running the test you may load saved file into GUI and see the values timeline.
PerfMon Server Agent
Installation
You do not need any root/admin privilege. You can just unzip the the ServerAgent-X.X.X.zip somewhere on the server. Then launch the agent using startAgent.sh script on Unix, or startAgent.bat script on Windows.
The agent is written in Java, so you will need JRE 1.4+ to run it. Note you can create yourself the agent package which includes its own JRE so you don't have to install java on the server (We tested it on windows platform). To do this, just create a JRE folder in the agent folder and copy one installed JRE inside. Change the java command inside the .bat file to the path to the java executable and it will work.
Once the agent is running, you can use the PerfMon Metrics Collector Listener to connect to the agents. You can add multiple servers to monitor, one graph can display several kinds of metrics (cpu, memory, etc...), auto-zooming rows for best view.
Usage
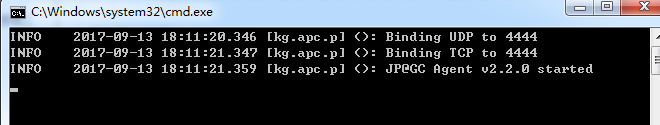
To start the agent, simply run startAgent bat/sh file. It will open UDP/TCP server ports where JMeter will connect and query the metrics. Some information will be printed to standard output, informing you on problems gathering metrics (logging verbosity regulated with --loglevel parameter).
PerfMon Metrics Collector and Server Agent原理和使用可以查看官方文档
具体可以查看官方的文档:
https://jmeter-plugins.org/wiki/PerfMon/
https://jmeter-plugins.org/wiki/PerfMonAgent/
下面对环境进行配置:
第一步:https://jmeter-plugins.org/wiki/PerfMonAgent/下载ServerAgent-2.2.1.zip,将ServerAgent-2.2.1.jar上传到被测服务器,解压可以直接运行 (Windows环境,双击ServerAgent.bat启动;linux环境执ServerAgent.sh启动,默认使用4444端口)
第二步:https://jmeter-plugins.org/downloads/old/下载JMeterPlugins-Standard-1.4.0.zip和JMeterPlugins-Extras-1.4.0.zip
PS:jmeter的plugin1.4.0的只支持jmeter3.2以下,不包括3.2!!!
第三步:然后解压两个zip包,把jar文件拷贝到/lib/ext文件夹下,环境配置就完成了。

新建测试用的取样器,并在监听器选择jp@gc - PerfMon Metrics Collector和jp@gc - Transactions per Second两个监听器,ServerAgent默认是4444端口,也可以修改,比如:./startAgent.sh –udp-port 0 –tcp-port 3450这样
进行加压的结果


在压测性能过程中,有一点非常非常非常重要:
Non GUI Mode
If you run JMeter in non GUI mode and want to save monitoring data to file, just configure result file saving in GUI as you do with other listeners. After running the test you may load saved file into GUI and see the values timeline.
Non GUI Mode If you run JMeter in non GUI mode and want to save monitoring data to file, just configure result file saving in GUI as you do with other listeners. After running the test you may load saved file into GUI and see the values timeline.
压测过程中一定要在 NON-GUI模式进行压测,这也是很多用JM的人经常忽略的地方,如果一个测试人员用JM压测性能的时候,还使用GUI模式压测,那么能够立马体现你的专业水平很low。
本篇文章只做GUI模式压测演示,需要查看如何进行NON-GUI模式进行,请查看小七前几篇文章。
最新文章
- jws.mono脚本安装详解
- requirejs:模块加载(require)及定义(define)时的路径小结
- 使用R进行地图相关的可视化
- System.load(String filename)和System.loadLibrary(String libname)的区别
- Entity Framework使用Sqlite时的一些配置
- C#------EntityFramework实体加载数据库SQLServer(MySQL)
- C++读取ini文件的类
- 自己动手实现STL:前言
- Linux特殊权限
- spring mvc 简单搭建
- BZOJ 3401: [Usaco2009 Mar]Look Up 仰望( 单调栈 )
- 反射导出excel案例
- 驱动10.nor flash
- (十七)java冒泡排序和compareto
- How to verify Certificate Pinning?
- jQuery之select的option怎样绑定事件
- 【很好的分享】zookeeper系列
- SQL中常用日期函数
- python 字符串常用操作方法
- 20165315 2017-2018-2《Java程序设计》课程总结