zabbix 自定义指标数据来源
2024-09-25 11:22:37
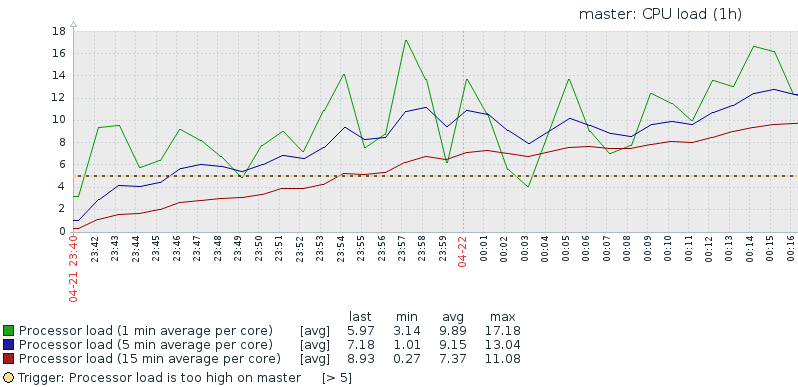
1.cpu load
- 1)基本含义:运行队列长度,表示当前有多少个正在等待的进程和正在执行的进程个数总和
- 2)单核CPU,为1代表100%CPU使用率,即CPU时间片都在计算
- 3)多核CPU,为1代表其中一个CPU100%使用率,比如双核,使用率也就是50%
- 4)一般而言,load的数值不应该超过CPU核心数
- 5)查看1/5/15分钟CPU load:
uptime,top - 6)查看CPU核数
cat /proc/cpuinfo|grep process|wc -l - 7)
cat /proc/loadavg
14.08 12.24 10.62 4/225 6045

1min  5min  15min runing process/total process runing process id
- 8)获取值
/usr/local/zabbix/bin/zabbix_get -s 127.0.0.1 -k system.cpu.load[,avg1]

5.370000

# 简单理解上面这个值是CPU的个数
zabbix_get [6982]: Get value error: cannot connect to [[127.0.0.1]:10050]: [111] Connection refused

# 遇到这个错误是iptables的问题

iptables -F
2.cpu usage
- 1)用户、内核、IO swap 、上下文等
- 2)使用率超过70%认为性能受影响
- 3)获取值uptime
[root@master proc]# /usr/local/zabbix/bin/zabbix_get -s 127.0.0.1 -k system.cpu.util[,idle]

19.411865

[root@master proc]# uptime

 00:50:26 up  1:11,  4 users,  load average: 12.24, 10.29, 9.77

[root@master proc]# cat /proc/uptime

4388.93 1133.00

[root@master proc]# more uptime

4419.07 1137.71

#服务器开机时间 服务器什么都没做的时间  单位秒

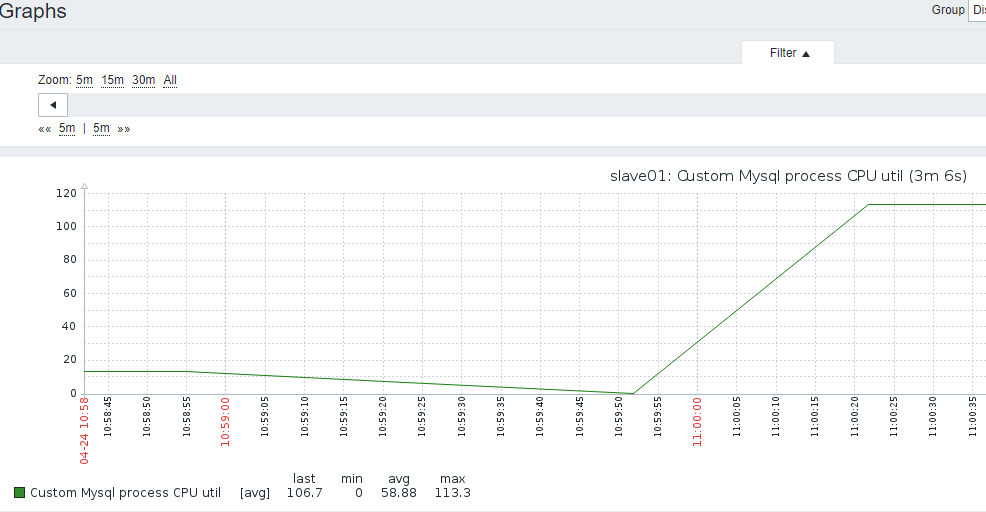
3.mysql实例进程CPU使用率
- 1)主机上,mysql的进程CPU监控
- 2)比如4个CPU,CPU使用率可以达到400%
- 3)获取进程CPU脚本
vi /usr/local/zabbix/etc/shell/mysql_cpu_util.sh

#!/bin/bash

ver=` grep -Po '\d{1}\.' /etc/redhat-release`

if [ "$ver" == "6." ]

then

    echo `ps aux | grep mysql$1.sock|grep mysqld | grep -v 'grep' | awk '{print $2}' | xargs pidstat  3 1 -p | tail -n2 | head -n1 | awk '{print $7}'`

else

    echo `ps aux | grep mysql$1.sock|grep mysqld | grep -v 'grep' | awk '{print $2}' | xargs  top -c -b -n 1 -p | tail -2|grep -Ev "^$"|awk 'NR==2{print $9}'`

fi
- 4)添加自定义conf
vi /usr/local/zabbix/etc/zabbix_agentd.conf.d/userparameter_custom.conf

UserParameter=MySQL.CPU_util,/usr/local/zabbix/etc/shell/mysql_cpu_util.sh
- 5)启动自定义脚本UnsafeUserParameters=1
- 6)重启agent,server上获取值
[root@slave01 ~]# /usr/local/zabbix/bin/zabbix_get -s 192.168.3.20 -k MySQL.CPU_util

20.0
7)添加监控item,信息类型要选择浮点数字型,因为带小数

8添加图形
9)关联主机
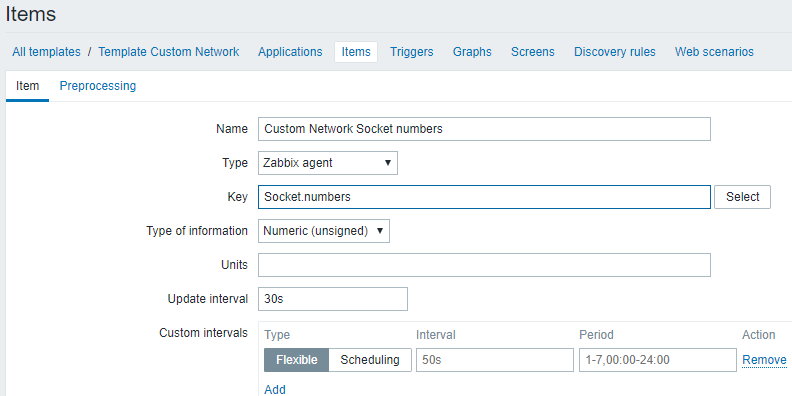
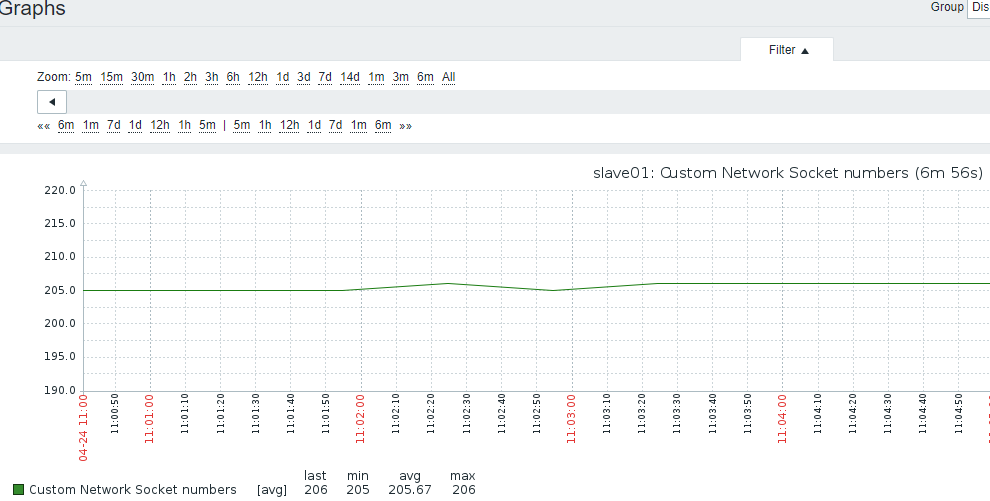
4.SOCKET连接数
- 1)原地址:端口 目标地址:端口 算一个socket连接
- 2)系统保留地址65535之内,可用地址61000-32768,约3个可用端口,也就是3W个socket
[root@master ipv4]# pwd

/proc/sys/net/ipv4

[root@master ipv4]# cat ip_local_port_range

32768   61000
- 3)获取值方法
vi /usr/local/zabbix/etc/zabbix_agentd.conf.d/userparameter_custom.conf

UserParameter=Socket.numbers,/usr/bin/cat /proc/net/sockstat |grep sockets|awk '{print $3}'
- 4)重启agent,server上获取值
232
5)添加监控item
6)添加图形
7)关联主机
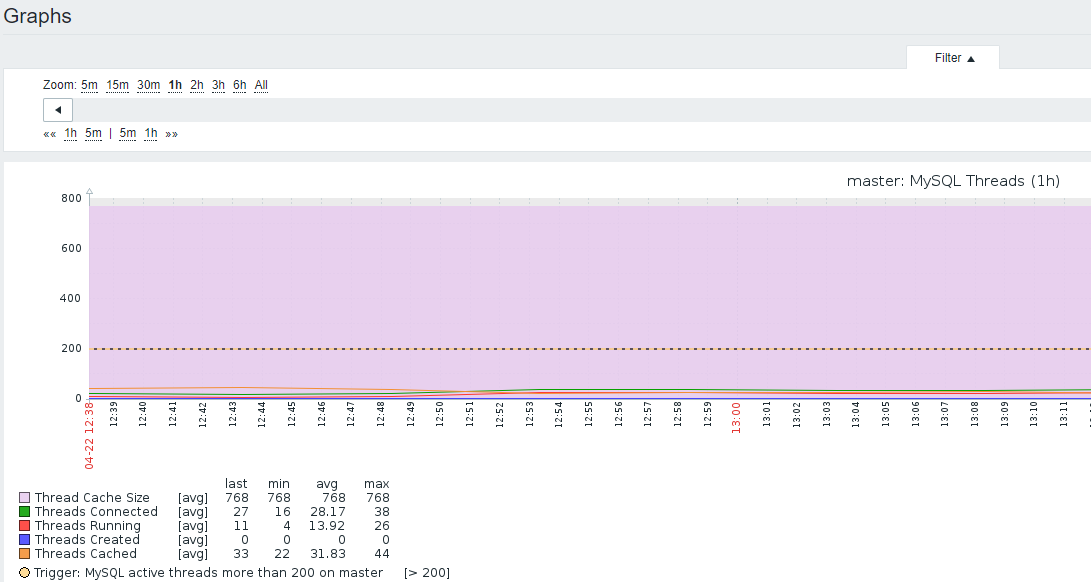
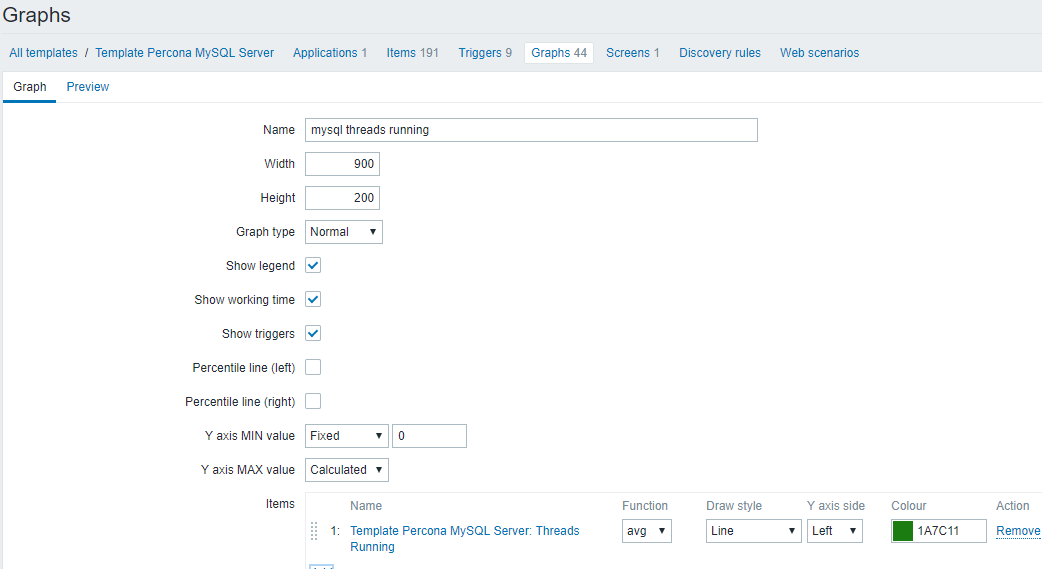
5.mysql run线程数:Threads running
1)使用percona模板
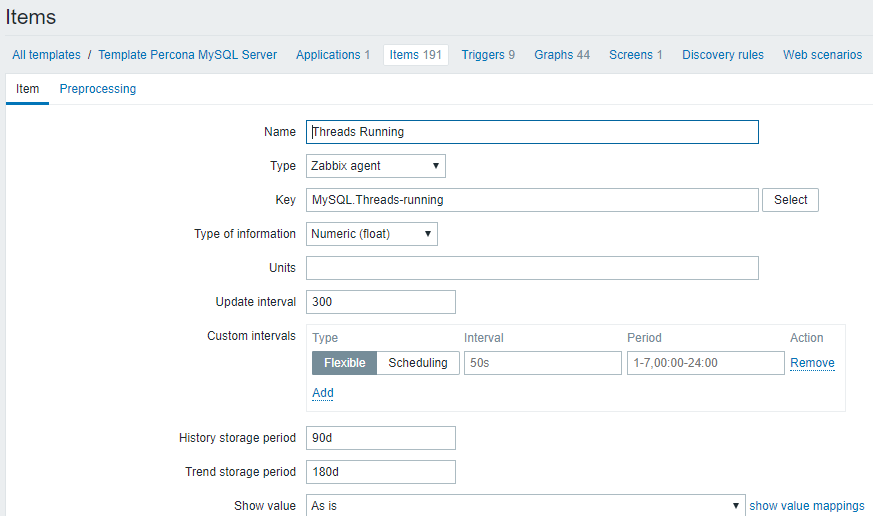
2)图形
3)数据来源
root@master 13:42:  [(none)]> show status like 'threads_running';

+-----------------+-------+

| Variable_name   | Value |

+-----------------+-------+

| Threads_running | 4     |

+-----------------+-------+

1 row in set (0.01 sec)

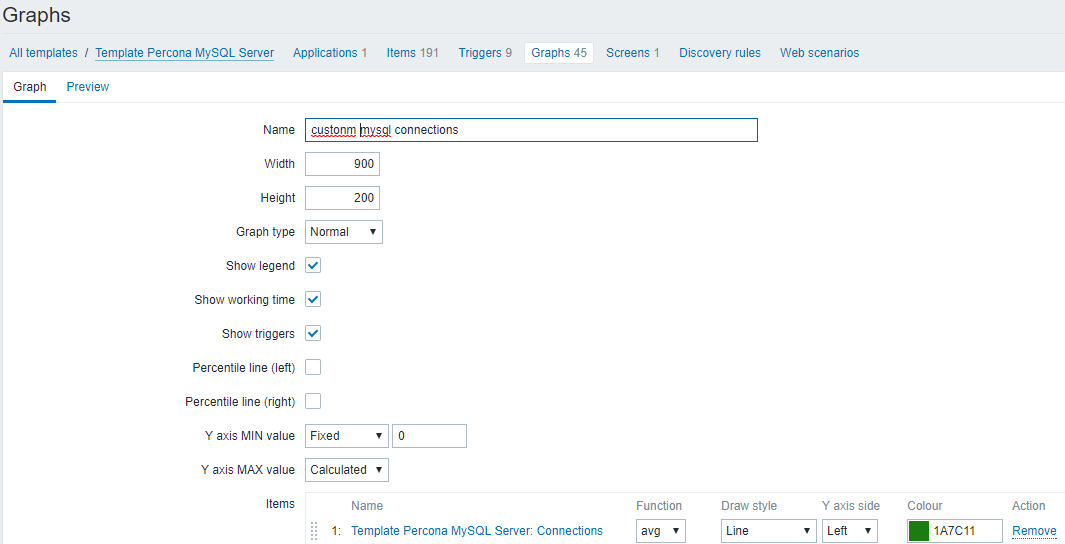
6.mysql CONN 连接数:Threads connected
- 1)取max_connections和max_user_connections
[root@master ~]# mysql -e "select * from information_schema.processlist" |grep -v -i "sleep"|wc -l

7

[root@master scripts]# /usr/bin/php /usr/local/zabbix/etc/percona/scripts/ss_get_mysql_stats.php --host localhost --items hn | awk -F: '{print $2}'
- 2)使用percona item自定义图形
7.BIG DML
1)将大DML语句条数和具体内容记录
2)截图

3)数据来源
[root@master shell]# vi /usr/local/zabbix/etc/shell/big_dml_count.sh

#!/bin/sh

/usr/local/mysql/bin/mysql -e "select count(*) from information_schema.processlist where state='Updating' and time>=100"|awk 'NR==2{print $1}'
- 4)添加自定监控内容
UserParameter=Mysql.BigDML,/usr/local/zabbix/etc/shell/big_dml_count.sh
- 5)怎么记录SQL?
9.diskstats-iostat人肉
https://blog.csdn.net/hao134838/article/details/57406028
/usr/local/zabbix/bin/zabbix_get -s 192.168.3.20 -k "disk.performance[await,avg]"
- 1)数据来源
UserParameter=custom.vfs.dev.read.ops[*],cat /proc/diskstats | grep $1 | head -1 | awk '{print $$4}'

# 磁盘读次数

UserParameter=custom.vfs.dev.read.ms[*],cat /proc/diskstats | grep $1 | head -1 | awk '{print $$7}'

# 磁盘读的毫秒数

UserParameter=custom.vfs.dev.write.ops[*],cat /proc/diskstats | grep $1 | head -1 | awk '{print $$8}'

# 磁盘写的次数

UserParameter=custom.vfs.dev.write.ms[*],cat /proc/diskstats | grep $1 | head -1 | awk '{print $$11}'

# 磁盘写的毫秒数

UserParameter=custom.vfs.dev.io.active[*],cat /proc/diskstats | grep $1 | head -1 | awk '{print $$12}'

# 花费在IO操作上的毫秒数

UserParameter=custom.vfs.dev.io.ms[*],cat /proc/diskstats | grep $1 | head -1 | awk '{print $$13}'

# 读扇区的次数,一个扇区512B

UserParameter=custom.vfs.dev.read.sectors[*],/usr/bin/echo `cat /proc/diskstats | grep $1 | head -1 | awk '{print $$6}'`*512|bc

UserParameter=custom.vfs.dev.write.sectors[*],/usr/bin/echo `cat /proc/diskstats | grep $1 | head -1 | awk '{print $$10}'`*512|bc

# 写扇区的次数,一个扇区512B
- 2)测试获取key值
/usr/local/zabbix/bin/zabbix_get -s 192.168.3.20 -k custom.vfs.dev.read.ms[sda]
- 3)建item
  配置第一个监控项

                   Name:  Disk:$1:Read:Bytes/sec

                   Key:  custom.vfs.dev.read.sectors[sda]

                   Units: B/sec

                   Store value: speed per second       //会进行差值计算

                   Use custom multiplier     512      //会对值乘以512,因为这里是一个扇区,转换为字节为512B

  第二监控项:和第一个一样的配置过程

                  Name:Disk:$1:Write:Bytes/sec

                  Key:          custom.vfs.dev.write.sectors[sda]

                  Units:        B/sec

                  Store value: speed per second

                  Use custom multiplier     512

  第三个监控项配置参数:

                 Name:Disk:$1:Read:ops per second

                  Key:          custom.vfs.dev.read.ops[sda]

                  Units:        ops/second

                  Store value: speed per second

  第四个监控项配置参数:

                 Name: Disk:$1:Write:ops per second

                  Key:          custom.vfs.dev.write.ops[sda]

                  Units:        ops/second

                  Store value: speed per second

 第五个监控项配置参数:

                 Name: Disk:$1:Read:ms

                  Key:         custom.vfs.dev.read.ms[sda]

                  Units:      ms

                  Store value: speed per second

 第六个监控项配置参数:

                 Name:Disk:$1:Write:ms

                  Key:         custom.vfs.dev.write.ms[sda]

                  Units:      ms

                  Store value: speed per second
10.IO await-iostat自动-都有问题
https://cloud.tencent.com/info/06d59fb507b3947b6e5330d834d94116.html

https://blog.csdn.net/bobpen/article/details/53408214

http://www.ttlsa.com/zabbix/zabbix-dynamic-io-monitor/

https://blog.csdn.net/u010871982/article/details/77718426

https://blog.csdn.net/bobpen/article/details/53408214

rqm/s: 每秒进行 merge 的读操作数目。即 rmerge/s

wrqm/s: 每秒进行 merge 的写操作数目。即 wmerge/s

r/s: 每秒完成的读 I/O 设备次数。即 rio/s

w/s: 每秒完成的写 I/O 设备次数。即 wio/s

rsec/s: 每秒读扇区数。即 rsect/s

wsec/s: 每秒写扇区数。即 wsect/s

rkB/s: 每秒读K字节数。是 rsect/s 的一半,因为每扇区大小为512字节。

wkB/s: 每秒写K字节数。是 wsect/s 的一半。

avgrq-sz: 平均每次设备I/O操作的数据大小 (扇区)。

avgqu-sz: 平均I/O队列长度。

await: 平均每次设备I/O操作的等待时间 (毫秒)。

svctm: 平均每次设备I/O操作的服务时间 (毫秒)。

%util: 一秒中有百分之多少的时间用于 I/O 操作,即被io消耗的cpu百分比
- 1)crontab获取iostat状态iostat.sh
* * * * * /bin/sh /usr/local/zabbix/etc/shell/iostat.s

[root@master tmp]# cat /usr/local/zabbix/etc/shell/iostat.sh

#!/bin/bash

#

#   Name:service 取出io数据用于分析

#   Version Number:1.01

#   Type: 取出I/O数据

#   Language:bash shell

#   Date:2017-08-07

#   Author:xiong

#

iostat -xdkt 5 3 > /tmp/io.txt

#

#times=`date +%H":"%M":"%S`

times=`date +%r`

#

# 取出最后一次iostat更新的数据,为最新数据,将最新的数据更新至/tmp/2.txt 不输出

grep "$times" -A 100 /tmp/io.txt  > /tmp/io2.txt
- 2)agent发现磁盘脚本discovery_iostat_disk.sh
discovery_iostat_disk.sh

#!/bin/bash

#

#   Name:service 自动发现io_磁盘

#   Version Number:1.01

#   Type: 自动发现io_磁盘

#   Language:bash shell

#   Date:2017-08-07

#   Author:xiong

#

disk=(`awk '{print $1}' /tmp/io2.txt | sed -e "1,2d"`)

length=${#disk[@]}

#

printf "{\n"

printf "\t\"data\":[\n"

for ((i=0;i<$length;i++)); do

        printf '\t\t{'

        printf "\"{#disk_name}\":\"${disk[$i]}\"}"

        if [ $i -lt $[$length - 1] ];then

                printf ",\n"

        fi

done

printf "\n\t]\n"

printf "}\n"
- 3)agent key脚本zabbix_iostat_disk.sh
#!/bin/bash

#

#   Name:service 自动发现io_磁盘

#   Version Number:1.01

#   Type: 自动发现io_磁盘

#   Language:bash shell

#   Date:2017-08-07

#   Author:xiong

#

disk=$1

case $2 in

rrqm)

	grep "$disk" /tmp/io2.txt | awk '{print $2}' ;;

wrqm)

	grep "$disk" /tmp/io2.txt | awk '{print $3}' ;;

rs)

	grep "$disk" /tmp/io2.txt | awk '{print $4}' ;;

ws)

	grep "$disk" /tmp/io2.txt | awk '{print $5}' ;;

rkB)

	grep "$disk" /tmp/io2.txt | awk '{print $6}' ;;

wkB)

	grep "$disk" /tmp/io2.txt | awk '{print $7}' ;;

avgrqsz)

	grep "$disk" /tmp/io2.txt | awk '{print $8}' ;;

avgqusz)

	grep "$disk" /tmp/io2.txt | awk '{print $9}' ;;

await)

	grep "$disk" /tmp/io2.txt | awk '{print $10}' ;;

rawait)

	grep "$disk" /tmp/io2.txt | awk '{print $11}' ;;

wawait)

	grep "$disk" /tmp/io2.txt | awk '{print $12}' ;;

svctm)

	grep "$disk" /tmp/io2.txt | awk '{print $13}' ;;

util)

	grep "$disk" /tmp/io2.txt | awk '{print $14}' ;;

esac*)

        echo "使用方法  /bash disk_name disk_type"

        exit 5 ;;

esac
- 4)agent调用配置
UserParameter=io.dis.status[*],/usr/local/zabbix/etc/shell/discovery_iostat_disk.sh

UserParameter=io.status[*],/usr/local/zabbix/etc/shell/zabbix_iostat_disk.sh  $1 $2
- 5)自动发现
- 6)添加key
GITHUB-默认是centos6模板,7需要增加列
- 1)dev-discovery.sh,获取磁盘,sda之类的
#!/bin/bash

#

DEVICES=`iostat | awk '{ if ($1 ~ "^([shxv]|xv)d[a-z]$") { print $1 } }'`

#

COUNT=`echo "$DEVICES" | wc -l`

INDEX=0

echo '{"data":['

echo "$DEVICES" | while read LINE; do

    echo -n '{"{#DEVNAME}":"'$LINE'"}'

    INDEX=`expr $INDEX + 1`

    if [ $INDEX -lt $COUNT ]; then

        echo ','

    fi

done

echo ']}'
- 2)iostat-cron.sh,获取iostat数据,保存临时文件到/usr/local/zabbix/tmp
vi /usr/local/zabbix/etc/shell/iostat-cron.sh

#!/bin/bash

##################################

# Zabbix monitoring script

#

# Info:

#  - cron job to gather iostat data

#  - can not do real time as iostat data gathering will exceed

#    Zabbix agent timeout

##################################

# Contact:

#  vincent.viallet@gmail.com

##################################

# ChangeLog:

#  20100922     VV      initial creation

##################################

#

# source data file

DEST_DATA=/usr/local/zabbix/tmp/iostat-data

TMP_DATA=/usr/local/zabbix/tmp/iostat-data.tmp

#

#

# gather data in temp file first, then move to final location

# it avoids zabbix-agent to gather data from a half written source file

#

# iostat -kx 10 2 - will display 2 lines :

#  - 1st: statistics since boot -- useless

#  - 2nd: statistics over the last 10 sec

#

iostat -kx 10 2 > $TMP_DATA

mv $TMP_DATA $DEST_DATA
3)iostat-check.sh,根据第二步的iostat获取磁盘指标数值
#!/bin/bash

##################################

# Zabbix monitoring script

#

# iostat:

#  - IO

#  - running / blocked processes

#  - swap in / out

#  - block in / out

#

# Info:

#  - vmstat data are gathered via cron job

##################################

# Contact:

#  vincent.viallet@gmail.com

##################################

# ChangeLog:

#  20100922     VV      initial creation

##################################

#

# Zabbix requested parameter

ZBX_REQ_DATA="$2"

ZBX_REQ_DATA_DEV="$1"

#

# source data file

SOURCE_DATA=/usr/local/zabbix/tmp/iostat-data

#

#

# Error handling:

#  - need to be displayable in Zabbix (avoid NOT_SUPPORTED)

#  - items need to be of type "float" (allow negative + float)

#

ERROR_NO_DATA_FILE="-0.9900"

ERROR_OLD_DATA="-0.9901"

ERROR_WRONG_PARAM="-0.9902"

ERROR_MISSING_PARAM="-0.9903"

#

# No data file to read from

if [ ! -f "$SOURCE_DATA" ]; then

  echo $ERROR_NO_DATA_FILE

  exit 1

fi

#

# Missing device to get data from

if [ -z "$ZBX_REQ_DATA_DEV" ]; then

  echo $ERROR_MISSING_PARAM

  exit 1

fi

#

#

# Old data handling:

#  - in case the cron can not update the data file

#  - in case the data are too old we want to notify the system

# Consider the data as non-valid if older than OLD_DATA minutes

#

OLD_DATA=5

if [ $(stat -c "%Y" $SOURCE_DATA) -lt $(date -d "now -$OLD_DATA min" "+%s" ) ]; then

  echo $ERROR_OLD_DATA

  exit 1

fi

#

#

# Grab data from SOURCE_DATA for key ZBX_REQ_DATA

#

# 1st check the device exists and gets data gathered by cron job

device_count=$(grep -Ec "^$ZBX_REQ_DATA_DEV " $SOURCE_DATA)

if [ $device_count -eq 0 ]; then

  echo $ERROR_WRONG_PARAM

  exit 1

fi

#

# 2nd grab the data from the source file

case $ZBX_REQ_DATA in

  rrqm/s)     grep -E "^$ZBX_REQ_DATA_DEV " $SOURCE_DATA | tail -1 | awk '{print $2}';;

  wrqm/s)     grep -E "^$ZBX_REQ_DATA_DEV " $SOURCE_DATA | tail -1 | awk '{print $3}';;

  r/s)        grep -E "^$ZBX_REQ_DATA_DEV " $SOURCE_DATA | tail -1 | awk '{print $4}';;

  w/s)        grep -E "^$ZBX_REQ_DATA_DEV " $SOURCE_DATA | tail -1 | awk '{print $5}';;

  rkB/s)      grep -E "^$ZBX_REQ_DATA_DEV " $SOURCE_DATA | tail -1 | awk '{print $6}';;

  wkB/s)      grep -E "^$ZBX_REQ_DATA_DEV " $SOURCE_DATA | tail -1 | awk '{print $7}';;

  avgrq-sz)      grep -E "^$ZBX_REQ_DATA_DEV " $SOURCE_DATA | tail -1 | awk '{print $8}';;

  avgqu-sz)   grep -E "^$ZBX_REQ_DATA_DEV " $SOURCE_DATA | tail -1 | awk '{print $9}';;

  await)      grep -E "^$ZBX_REQ_DATA_DEV " $SOURCE_DATA | tail -1 | awk '{print $10}';;

  rawait)      grep -E "^$ZBX_REQ_DATA_DEV " $SOURCE_DATA | tail -1 | awk '{print $11}';;

  wawait)      grep -E "^$ZBX_REQ_DATA_DEV " $SOURCE_DATA | tail -1 | awk '{print $12}';;

  svctm)      grep -E "^$ZBX_REQ_DATA_DEV " $SOURCE_DATA | tail -1 | awk '{print $13}';;

  %util)      grep -E "^$ZBX_REQ_DATA_DEV " $SOURCE_DATA | tail -1 | awk '{print $14}';;

  *) echo $ERROR_WRONG_PARAM; exit 1;;

esac

#

exit 0
- 4)agent信息
UserParameter=iostat.custom.vfs.dev.discovery,/bin/sh /usr/local/zabbix/etc/shell/dev-discovery.sh

UserParameter=iostat.iostat[*],/bin/sh /usr/local/zabbix/etc/shell/iostat-check.sh $1 $2
5)crontab
* * * * * /bin/sh /usr/local/zabbix/etc/shell/iostat-cron.sh6)导入模板zbx_export_templates_iostat.xml
7)关联主机
12.slave/IO状态
if [ "$(sh /usr/local/zabbix/etc/shell/sql_relay_3306.sh| grep "Slave_IO_Running"|awk '{print $2}')" == "Yes" ];then echo 1; else echo 0;fi

13.slave/SQL状态

if [ "$(sh /usr/local/zabbix/etc/shell/sql_relay_3306.sh| grep "Slave_SQL_Running:"|awk '{print $2}')" == "Yes" ];then echo 1; else echo 0;fi

14.Slave/Delay

/bin/sh /usr/local/zabbix/etc/shell/sql_relay_3306.sh | grep Seconds_Behind_Master | awk '{print $2}'`
15.上面三个的zabbix agent配置
vi /usr/local/zabbix/etc/shell/show_slave_status.sh

#!/bin/sh

mysql -umysqlcheck -pmysqlcheck -hlocalhost -e "show slave status\G"

#

UserParameter=MySQL.Slave_IO_Running, if [ "$(sh /usr/local/zabbix/etc/shell/show_slave_status.sh| grep "Slave_IO_Running"|awk '{print $2}')" == "Yes" ];then echo 1; else echo 0;fi

UserParameter=MySQL.Slave_SQL_Running, if [ "$(sh /usr/local/zabbix/etc/shell/show_slave_status.sh| grep "Slave_SQL_Running:"|awk '{print $2}')" == "Yes" ];then echo 1; else echo 0;fi

UserParameter=MySQL.Slave_delay, /bin/sh  /usr/local/zabbix/etc/shell/show_slave_status.sh | grep Seconds_Behind_Master | awk '{print $2}'
最新文章
- PDO连接mysql数据库
- PHP JSON数组与对象的理解
- unlink和close关系
- SQL GETDATE()日期格式化函数
- Install Visual Studio For Mac Preview
- 【Mysql】phpMyAdmin安装与配置
- iOS 开发ALAsset获取图片缩略图
- iOS开发项目之四 [ 调整自定义tabbar的位置与加号按钮的位置]
- 金蝶K3 破解版
- C++11内存模型的一些补充阅读材料
- R语言 关联规则
- beginBackgroundTaskWithExpirationHandle
- IT人常用的网站
- Flux --> Redux --> Redux React 入门
- Git安装与上传代码至Github
- vim代码粘贴缩进混乱的问题[Linux]
- Linux之磁盘分区
- 第一章 odoo的配置(centos7 版)
- 【bzoj1507】 JSOI2008—Blue Mary的旅行
- Split Array into Consecutive Subsequences