Highcharts图表库
2024-10-21 14:35:56
Highcharts图表库
1、相关网址:
1)官方主页:https://www.hcharts.cn/
2)Highcharts演示:https://www.hcharts.cn/demo/highcharts
3)下载中心:https://www.hcharts.cn/download
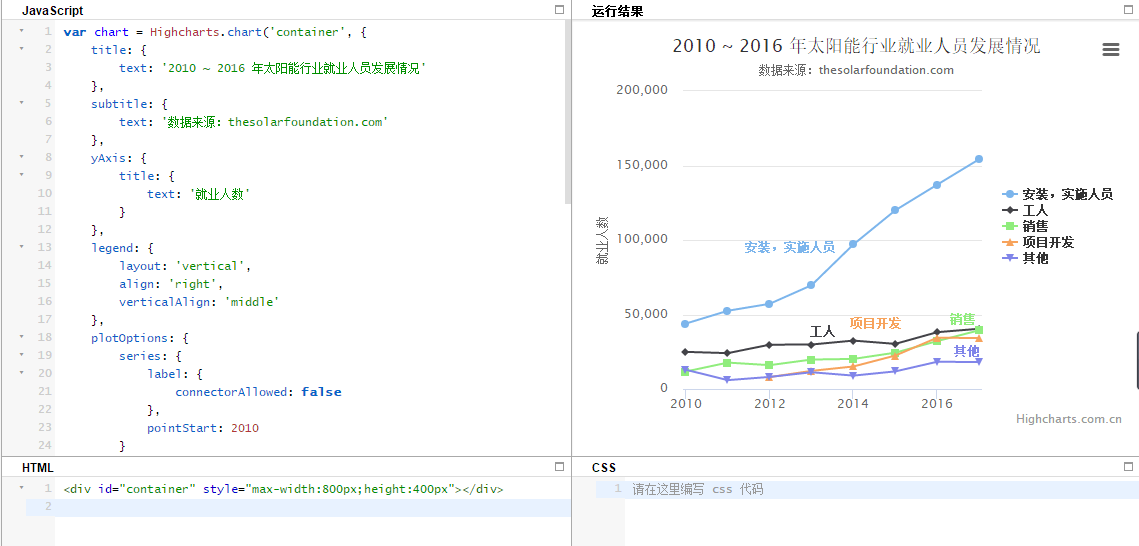
2、查看源代码
1)在图表演示页面找到需要的图表点击进入具体演示图
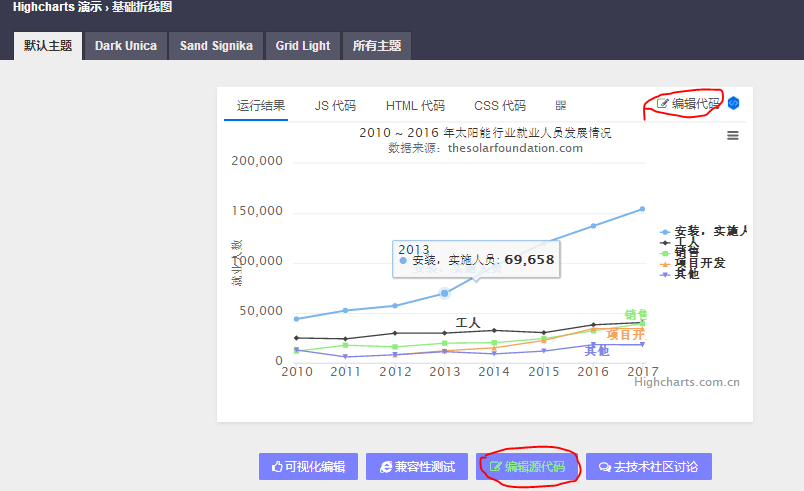
2)将代码中的数据改为需要的数据代码可以直接使用
3、使用实例
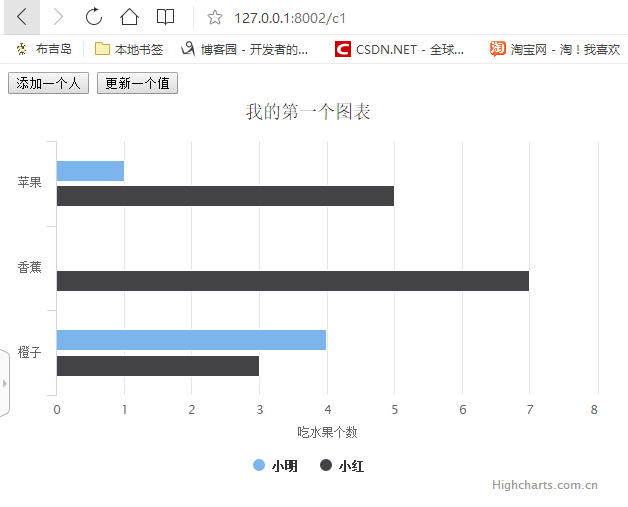
1)条形图
<!DOCTYPE html>

<html lang="en">

<head>

    <meta charset="UTF-8">

    <title>Title</title>

</head>

<body>

<input type="button" onclick="addSeries()" value="添加一个人">

<input type="button" onclick="updateItem()" value="更新一个值">

<div id="container" style="width: 600px;height:400px;"></div>

<script src="/static/js/highcharts.js"></script>

<script src="/static/js/highcharts-zh_CN.js"></script>

<script>

    var options = {

        chart: {

            type: 'bar'                          //指定图表的类型,默认是折线图(line)

        },

        title: {

            text: '我的第一个图表'                 // 标题

        },

        xAxis: {

            categories: ['苹果', '香蕉', '橙子']   // x 轴分类

        },

        yAxis: {

            title: {

                text: '吃水果个数'                // y 轴标题

            }

        },

        series: [{                              // 数据列

            name: '小明',                        // 数据列名

            data: [1, 0, 4]                     // 数据

        }, {

            name: '小红',

            data: [5, 7, 3]

        }]

    };

    // 图表初始化函数

    var chart = Highcharts.chart('container', options);

    function addSeries() {

        chart.addSeries({name: '小刘', data: [30.4, 10.1, 9]});

    }

    function updateItem() {

        chart.series[0].data[0].update(6);

    }

</script>

</body>

</html>
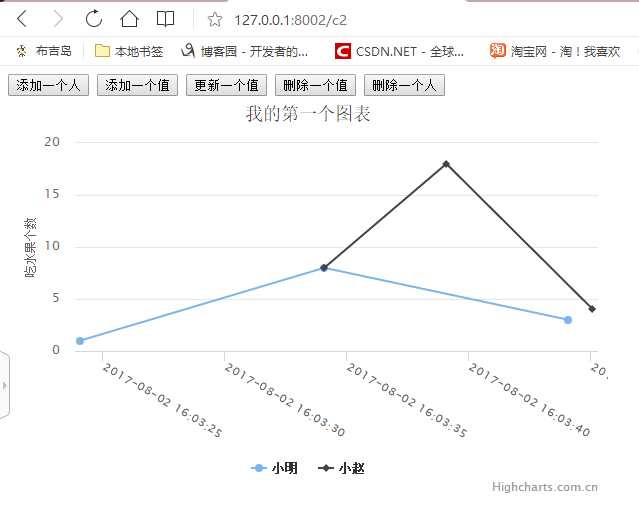
2)折线图
<!DOCTYPE html>

<html lang="en">

<head>

    <meta charset="UTF-8">

    <title>Title</title>

</head>

<body>

<input type="button" onclick="addSeries()" value="添加一个人">

<input type="button" onclick="addItem()" value="添加一个值">

<input type="button" onclick="updateItem()" value="更新一个值">

<input type="button" onclick="delItem()" value="删除一个值">

<input type="button" onclick="delSeries()" value="删除一个人">

<div id="container" style="width: 600px;height:400px;"></div>

<script src="/static/js/highcharts.js"></script>

<script src="/static/js/highcharts-zh_CN.js"></script>

<script>

    var options = {

        title: {

            text: '我的第一个图表'                 // 标题

        },

        xAxis: {

            type: 'datetime',

            labels: {

                formatter: function () {

                    return Highcharts.dateFormat('%Y-%m-%d %H:%M:%S', this.value);

                },

                rotation: 30

            }

        },

        yAxis: {

            title: {

                text: '吃水果个数'                // y 轴标题

            }

        },

        series: [{                              // 数据列

            name: '小明',                        // 数据列名

            data: [

                [1501689804077.358, 1.0],

                [1501689814077.358, 8.0],

                [1501689824077.358, 3.0]

            ]                     // 数据

        },

            {

                name: '小赵',

                data: [

                    [1501689814077.358, 8.0],

                    [1501689819077.358, 18.0],

                    [1501689825077.358, 4.0]

                ]                     // 数据

            }

        ]

    };

    // 图表初始化函数

    var chart = Highcharts.chart('container', options);

    function addSeries() {

        chart.addSeries({

            name: '小刘', data: [

                [1501689814077.358, 18.0],

                [1501689819077.358, 8.0],

                [1501689825077.358, 3.0]

            ]

        });

    }

    function updateItem() {

        //$('#id1').highcharts()

        chart.series[0].data[0].update(66);

    }

    function addItem() {

        chart.series[0].addPoint([1501689825077, 18]);

    }

    function delItem() {

        chart.series[0].data[1].remove();

    }

    function delSeries() {

        chart.series[0].remove(false);

    }

</script>

</body>

</html>
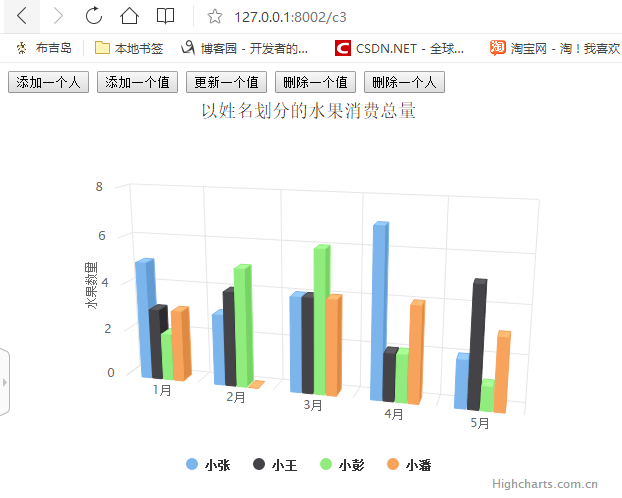
3)3d柱状图
<!DOCTYPE html>

<html lang="en">

<head>

    <meta charset="UTF-8">

    <title>Title</title>

</head>

<body>

<input type="button" onclick="addSeries()" value="添加一个人">

<input type="button" onclick="addItem()" value="添加一个值">

<input type="button" onclick="updateItem()" value="更新一个值">

<input type="button" onclick="delItem()" value="删除一个值">

<input type="button" onclick="delSeries()" value="删除一个人">

<div id="container" style="width: 600px;height:400px;"></div>

<script src="/static/js/highcharts.js"></script>

<script src="/static/js/highcharts-3d.js"></script>

<script src="/static/js/highcharts-zh_CN.js"></script>

<script>

    var options = {

        chart: {

            type: 'column',

            options3d: {

                enabled: true,

                alpha: 15,

                beta: 15,

                viewDistance: 25,

                depth: 40

            },

            marginTop: 80,

            marginRight: 40

        },

        title: {

            text: '以姓名划分的水果消费总量'

        },

        xAxis: {

            categories: ['1月', '2月', '3月', '4月', '5月', '6月']

        },

        yAxis: {

            allowDecimals: false,

            min: 0,

            title: {

                text: '水果数量'

            }

        },

        tooltip: {

            headerFormat: '<b>{point.key}</b><br>',

            pointFormat: '<span style="color:{series.color}">\u25CF</span> {series.name}: {point.y} '

        },

        plotOptions: {

            column: {

                //stacking: 'normal',

                //depth: 40

            }

        },

        series: [{

            name: '小张',

            data: [5, 3, 4, 7, 2]

        }, {

            name: '小王',

            data: [3, 4, 4, 2, 5]

        }, {

            name: '小彭',

            data: [2, 5, 6, 2, 1]

        }, {

            name: '小潘',

            data: [3, 0, 4, 4, 3]

        }]

    };

    // 图表初始化函数

    var chart = Highcharts.chart('container', options);

    function addSeries() {

        chart.addSeries({

            name: '小刘', data: [5, 3, 4, 7, 2]

        });

    }

    function updateItem() {

        //$('#id1').highcharts()

        chart.series[0].data[0].update(18);

    }

    function addItem() {

        chart.series[0].addPoint(18);

    }

    function delItem() {

        chart.series[0].data[1].remove();

    }

    function delSeries() {

        chart.series[0].remove(false);

    }

</script>

</body>

</html>
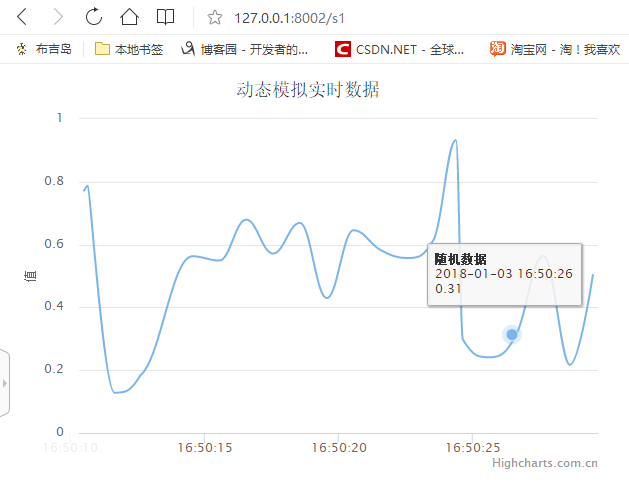
4)实时刷新曲线图
<!DOCTYPE html>

<html lang="en">

<head>

    <meta charset="UTF-8">

    <title>Title</title>

</head>

<body>

<div id="container" style="width: 600px;height:400px;"></div>

<script src="https://code.jquery.com/jquery-3.1.1.min.js"></script>

<script src="/static/js/highstock.js"></script>

<script src="/static/js/highcharts-zh_CN.js"></script>

<script>

    Highcharts.setOptions({

        global: {

            useUTC: false

        }

    });

    function activeLastPointToolip(chart) {

        var points = chart.series[0].points;

        chart.tooltip.refresh(points[points.length -1]);

    }

    $('#container').highcharts({

        chart: {

            type: 'spline',

            animation: Highcharts.svg, // don't animate in old IE

            marginRight: 10,

            events: {

                load: function () {

                    // set up the updating of the chart each second

                    var series = this.series[0],

                        chart = this;

                    setInterval(function () {

                        var x = (new Date()).getTime(), // current time

                            y = Math.random();

                        series.addPoint([x, y], true, true);

                        activeLastPointToolip(chart)

                    }, 1000);

                }

            }

        },

        title: {

            text: '动态模拟实时数据'

        },

        xAxis: {

            type: 'datetime',

            tickPixelInterval: 150

        },

        yAxis: {

            title: {

                text: '值'

            },

            plotLines: [{

                value: 0,

                width: 1,

                color: '#808080'

            }]

        },

        tooltip: {

            formatter: function () {

                return '<b>' + this.series.name + '</b><br/>' +

                    Highcharts.dateFormat('%Y-%m-%d %H:%M:%S', this.x) + '<br/>' +

                    Highcharts.numberFormat(this.y, 2);

            }

        },

        legend: {

            enabled: false

        },

        exporting: {

            enabled: false

        },

        series: [{

            name: '随机数据',

            data: (function () {

                // generate an array of random data

                var data = [],

                    time = (new Date()).getTime(),

                    i;

                for (i = -19; i <= 0; i += 1) {

                    data.push({

                        x: time + i * 1000,

                        y: Math.random()

                    });

                }

                return data;

            }())

        }]

    }, function(c) {

        activeLastPointToolip(c)

    });

</script>

</body>

</html>
最新文章
- SqlServer数据库大型应用解决方案总结
- ASP.Net中的Web Resource
- Windows Store App JavaScript 开发:WinJS库控件
- inline-block
- 在 CentOS 7 中安装并使用自动化工具 Ansible
- tmux的使用方法和个性化配置
- Android 高级UI设计笔记15:HorizontalScrollView之 实现画廊式图片浏览器
- 第六届华为创新杯编程大赛-进阶1第1轮 洞穴逃生 (bfs + 优先队列)
- A Byte of Python 笔记(2)基本概念:数、字符串、转义符、变量、标识符命名、数据类型、对象
- Java 9 揭秘(3. 创建你的第一个模块)
- 201521123080《Java程序设计》第13周学习总结
- TKCPP
- Google SRE
- Go基础系列:struct的导出和暴露问题
- LeetCode算法题-Binary Watch(Java实现)
- Codeforces#543 div2 B. Mike and Children(暴力?)
- MySQL伪master+Binlog+同步【转】
- 渗透测试(theharvester >>steghide)
- jq closet的使用,找到距离最近的一个父元素;
- springboot属性类自动加载配置文件中的值
热门文章
- vuepress-theme-reco + Github Actions 构建静态博客,部署到第三方服务器
- oracle去除重复数据与oracle分页
- mysql & Tomcat使用问题记录
- MyBatis框架——快速入门
- 洛谷1063 +区间dp(经典问题)
- 题解 P1457 【城堡 The Castle】
- 基于arduino、百度云、采用django、redis鱼缸在线监控
- Building Applications with Force.com and VisualForce(Dev401)(十三):Implementing Business Processes:Automating Business Processes Part II
- 从零开始发布一个ArcGIS Server地图服务
- spring-cloud-gateway动态路由