SpringCloud学习成长之十三 断路器聚合监控
上一篇文章讲述了如何利用Hystrix Dashboard去监控断路器的Hystrix command。当我们有很多个服务的时候,这就需要聚合所以服务的Hystrix Dashboard的数据了。这就需要用到Spring Cloud的另一个组件了,即Hystrix Turbine。
一、Hystrix Turbine简介
看单个的Hystrix Dashboard的数据并没有什么多大的价值,要想看这个系统的Hystrix Dashboard数据就需要用到Hystrix Turbine。Hystrix Turbine将每个服务Hystrix Dashboard数据进行了整合。Hystrix Turbine的使用非常简单,只需要引入相应的依赖和加上注解和配置就可以了。
二、准备工作
本文使用的工程为上一篇文章的工程,在此基础上进行改造。因为我们需要多个服务的Dashboard,所以需要再建一个服务,取名为service-lucy,它的基本配置同service-hi,具体见源码,在这里就不详细说明。
三、创建service-turbine
引入相应的依赖:
<dependencies>

        <dependency>

            <groupId>org.springframework.cloud</groupId>

            <artifactId>spring-cloud-starter-turbine</artifactId>

        </dependency>

        <dependency>

            <groupId>org.springframework.cloud</groupId>

            <artifactId>spring-cloud-netflix-turbine</artifactId>

        </dependency>

        <dependency>

            <groupId>org.springframework.boot</groupId>

            <artifactId>spring-boot-starter-actuator</artifactId>

        </dependency>

        <dependency>

            <groupId>org.springframework.boot</groupId>

            <artifactId>spring-boot-starter-test</artifactId>

            <scope>test</scope>

        </dependency>

    </dependencies>
在其入口类ServiceTurbineApplication加上注解@EnableTurbine,开启turbine,@EnableTurbine注解包含了@EnableDiscoveryClient注解,即开启了注册服务。
@SpringBootApplication

@EnableTurbine

public class ServiceTurbineApplication {

    public static void main(String[] args) {

            new SpringApplicationBuilder(ServiceTurbineApplication.class).web(true).run(args);

    }

}
配置文件application.yml:
spring:

  application.name: service-turbine

server:

  port: 8769

security.basic.enabled: false

turbine:

  aggregator:

    clusterConfig: default   # 指定聚合哪些集群,多个使用","分割,默认为default。可使用http://.../turbine.stream?cluster={clusterConfig之一}访问

  appConfig: service-hi,service-lucy  ### 配置Eureka中的serviceId列表,表明监控哪些服务

  clusterNameExpression: new String("default")

  # 1. clusterNameExpression指定集群名称,默认表达式appName;此时:turbine.aggregator.clusterConfig需要配置想要监控的应用名称

  # 2. 当clusterNameExpression: default时,turbine.aggregator.clusterConfig可以不写,因为默认就是default

  # 3. 当clusterNameExpression: metadata['cluster']时,假设想要监控的应用配置了eureka.instance.metadata-map.cluster: ABC,则需要配置,同时turbine.aggregator.clusterConfig: ABC

eureka:

  client:

    serviceUrl:

      defaultZone: http://localhost:8761/eureka/
配置文件注解写的很清楚。
四、Turbine演示
依次开启eureka-server、service-hi、service-lucy、service-turbine工程。
打开浏览器输入:http://localhost:8769/turbine.stream,界面如下:
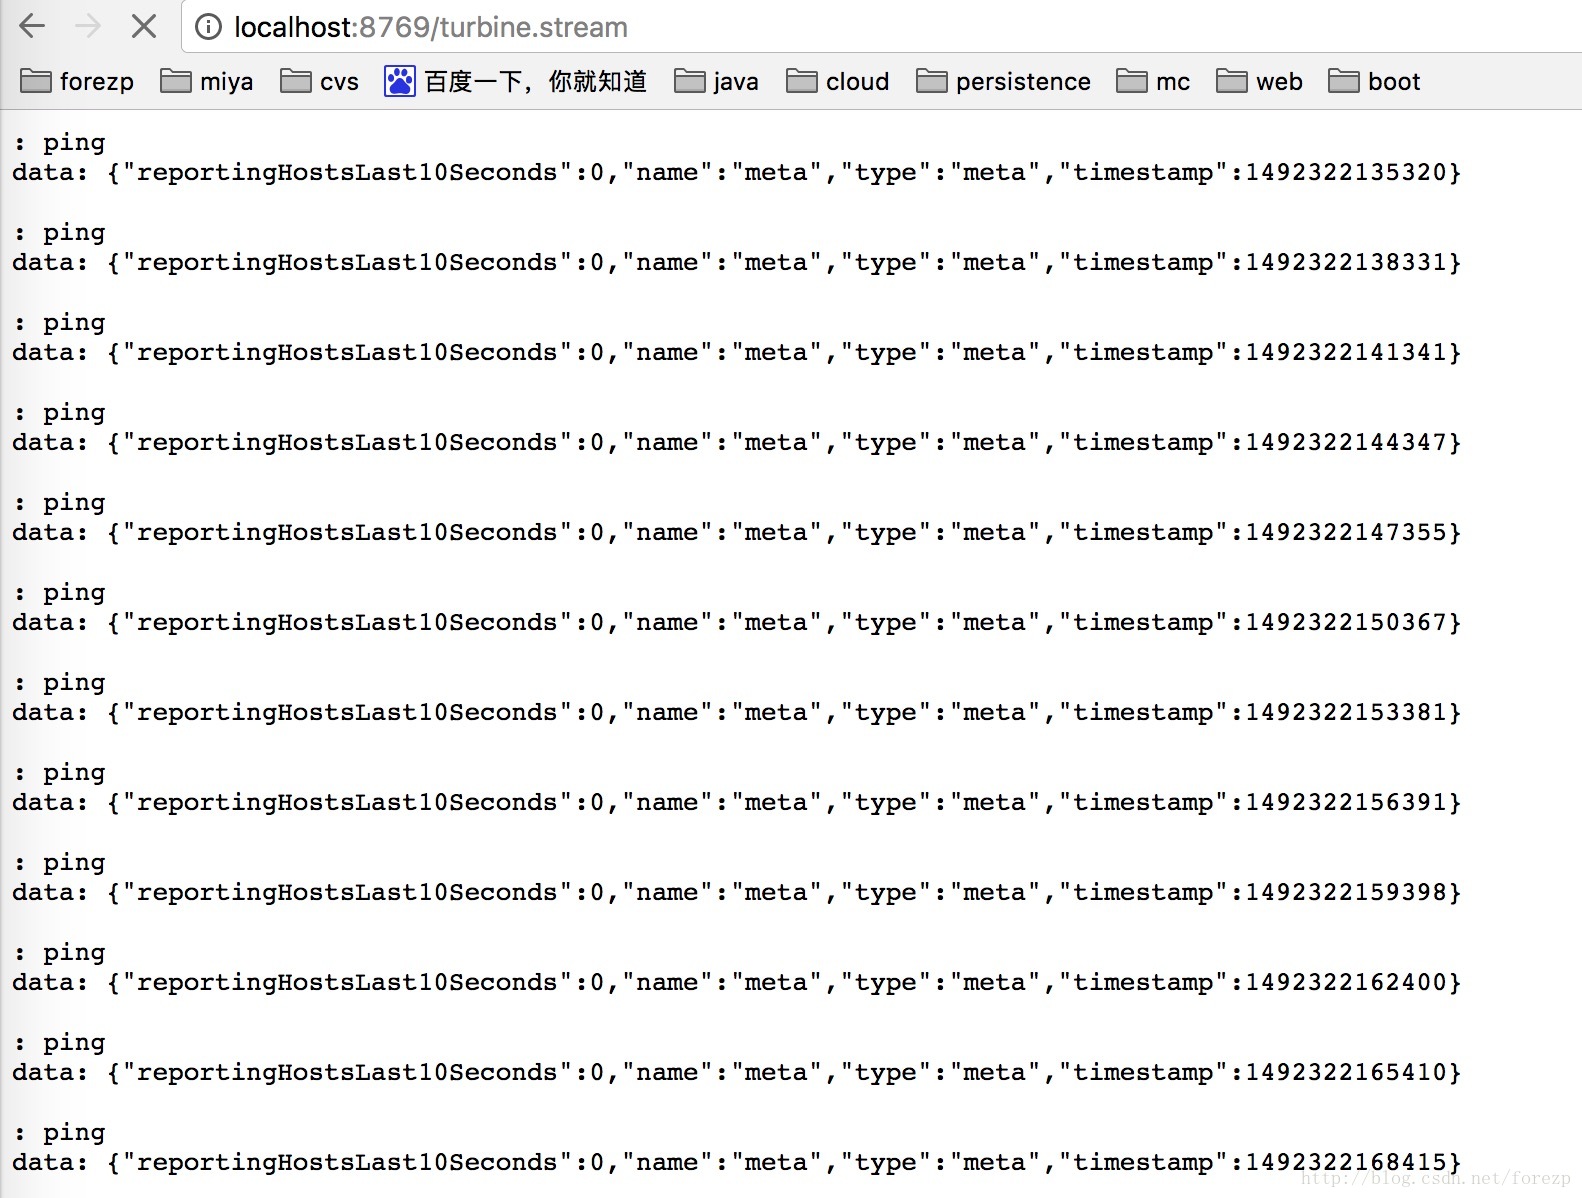
依次请求:
打开:http://localhost:8763/hystrix,输入监控流http://localhost:8769/turbine.stream
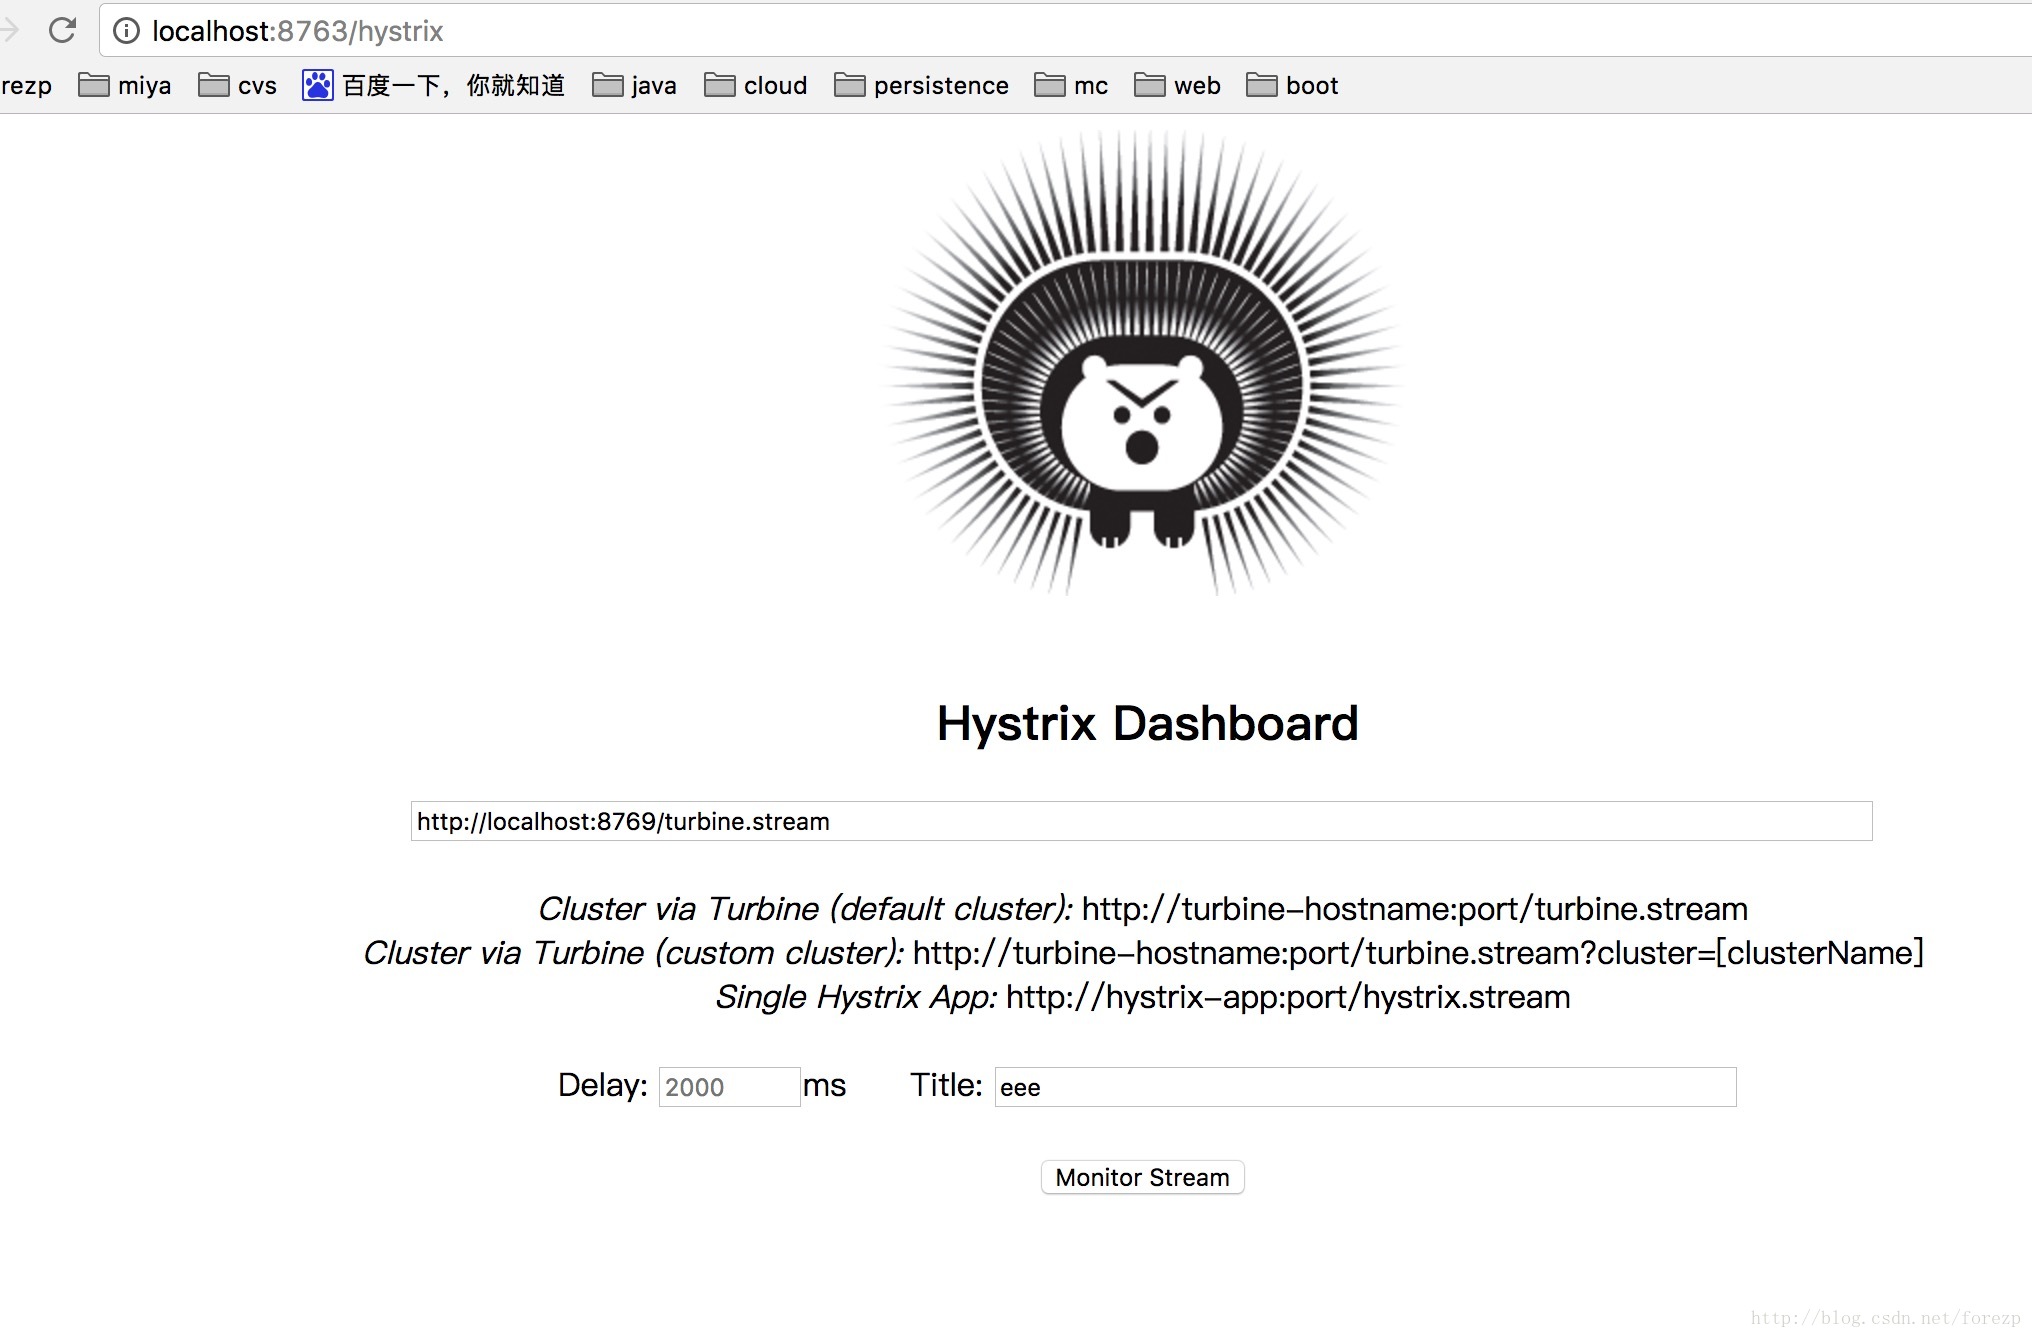
点击monitor stream 进入页面:

可以看到这个页面聚合了2个service的hystrix dashbord数据。
最新文章
- PHP Code Reviewing Learning
- UICollectionView 使用
- java提供了native2ascii工具
- Leetcode 225 Implement Stack using Queues
- Codeforces Round #310 (Div. 2) B. Case of Fake Numbers 水题
- oracle 语句汇总
- WPF笔记(2.3 StackPanel)——Layout
- ArcGIS多面体(multipatch)解析——引
- 在Vue项目使用quill-editor带样式编辑器(更改插入图片和视频)
- Socket 参数笔记
- html-webpack-plugin插件使用
- Kafka技术内幕 读书笔记之(六) 存储层——日志的读写
- 权限管理-ACL
- python的MD5
- Arcgis发布服务
- [mBean]-Delphi框架,回归简单,自然。
- LeetCode: Validate Binary Search Tree 解题报告
- js url?callback=xxx xxx的介绍
- C#项目学习 心得笔记本
- 使用Redis实现抢购的一种思路(list队列实现)