Django API 为 D3 提供数据
2024-10-22 05:01:00
在工作中见过有的人即便使用了Django,依然还在采取json或geojson的文件形式为页面提供数据,相当于嵌入数据而非加载。下面是个简单有效的例子:
先从 model.py 开始
 # models.py

 from django.db import models

 class Play(models.Model):

     name = models.CharField(max_length=100)

     date = models.DateTimeField()
urls.py 建立一个 API 的数据(JSON格式)输出路径,另一个给图像输出页面。
 # urls.py

 from django.conf.urls import url

 from .views import graph, play_count_by_month

 urlpatterns = [

     url(r'^$', graph),

     url(r'^api/play_count_by_month', play_count_by_month, name='play_count_by_month'),

 ]
views.py
# views.py

from django.db import connections

from django.db.models import Count

from django.http import JsonResponse

from django.shortcuts import render

from .models import Play

def graph(request):

    return render(request, 'graph/graph.html')

def play_count_by_month(request):

    data = Play.objects.all() \

        .extra(select={'month': connections[Play.objects.db].ops.date_trunc_sql('month', 'date')}) \

        .values('month') \

        .annotate(count_items=Count('id'))

    return JsonResponse(list(data), safe=False)
下面则是HTML部分
 <!DOCTYPE html>

 <meta charset="utf-8">

 <style>

 body {

   font: 10px sans-serif;

 }

 .axis path,

 .axis line {

   fill: none;

   stroke: #000;

   shape-rendering: crispEdges;

 }

 .x.axis path {

   display: none;

 }

 .line {

   fill: none;

   stroke: steelblue;

   stroke-width: 1.5px;

 }

 </style>

 <body>

 <script src="http://d3js.org/d3.v3.js"></script>

 <script>

 var margin = {top: 20, right: 20, bottom: 30, left: 50},

     width = 960 - margin.left - margin.right,

     height = 500 - margin.top - margin.bottom;

 var parseDate = d3.time.format("%Y-%m-%d").parse; // for dates like "2014-01-01"

 //var parseDate = d3.time.format("%Y-%m-%dT00:00:00Z").parse;  // for dates like "2014-01-01T00:00:00Z"

 var x = d3.time.scale()

     .range([0, width]);

 var y = d3.scale.linear()

     .range([height, 0]);

 var xAxis = d3.svg.axis()

     .scale(x)

     .orient("bottom");

 var yAxis = d3.svg.axis()

     .scale(y)

     .orient("left");

 var line = d3.svg.line()

     .x(function(d) { return x(d.month); })

     .y(function(d) { return y(d.count_items); });

 var svg = d3.select("body").append("svg")

     .attr("width", width + margin.left + margin.right)

     .attr("height", height + margin.top + margin.bottom)

   .append("g")

     .attr("transform", "translate(" + margin.left + "," + margin.top + ")");

 d3.json("{% url "play_count_by_month" %}", function(error, data) {

   data.forEach(function(d) {

     d.month = parseDate(d.month);

     d.count_items = +d.count_items;

   });

   x.domain(d3.extent(data, function(d) { return d.month; }));

   y.domain(d3.extent(data, function(d) { return d.count_items; }));

   svg.append("g")

       .attr("class", "x axis")

       .attr("transform", "translate(0," + height + ")")

       .call(xAxis);

   svg.append("g")

       .attr("class", "y axis")

       .call(yAxis)

     .append("text")

       .attr("transform", "rotate(-90)")

       .attr("y", 6)

       .attr("dy", ".71em")

       .style("text-anchor", "end")

       .text("Play count");

   svg.append("path")

       .datum(data)

       .attr("class", "line")

       .attr("d", line);

 });

 </script>

 </body>

 </html>
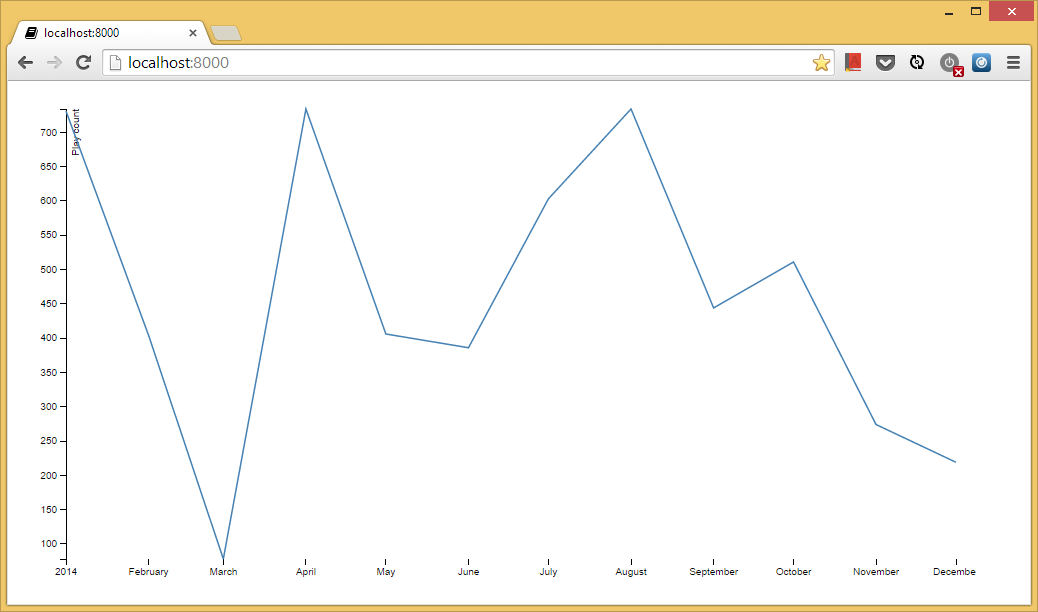
输出结果,大家可以在admin里调整数据。
最新文章
- 07@Pattern_Note_命令模式
- MHA故障切换和在线手工切换原理
- wpf学习笔记
- CentOS 7 安装Docker
- webApi中参数传递
- Microsoft Visual Studio Ultimate 2013 with Update 3 CN+EN
- WPF中多窗口共享静态属性
- Cocos2d-x手机游戏开发中-组合动作
- Amazon S3 上传文件 SSL23_GET_SERVER_HELLO握手错误
- sql server多行数据(一列)转换成一个字段
- Linux内核中断和异常分析(上)
- Android学习笔记之SoftReference软引用,弱引用WeakReference
- nnet3的并行化训练
- Python的GUI编程(TK)
- Codeforces Educational Round 37
- rabbitmq 部署(二进制和rpm)与常用命令
- 用python实现一个无界面的2048
- 解决Duilib集成CEF浏览器在Win10无法向客户区拖拽文件
- The Road to Ryu: Hi Ryu
- 打包python文件,让文件程序化