《DSP using MATLAB》Problem 8.14
2024-09-03 17:45:19

代码:
%% ------------------------------------------------------------------------
%% Output Info about this m-file
fprintf('\n***********************************************************\n');
fprintf(' <DSP using MATLAB> Problem 8.14 \n\n'); banner();
%% ------------------------------------------------------------------------ Wp = 10; Ws = 15; Rp = 1; As = 50;
Fp = Wp/(2*pi);
Fs = Ws/(2*pi); Ripple = 10 ^ (-Rp/20)
Attn = 10 ^ (-As/20) % Analog filter design:
[b, a] = afd('cheby1', Fp, Fs, Rp, As);
%[b, a] = afd_chb1(Wp, Ws, Rp, As); % Calculation of second-order sections:
[C, B, A] = sdir2cas(b, a); % Calculation of Frequency Response:
[db, mag, pha, ww] = freqs_m(b, a, 20); % Calculation of Impulse Response:
[ha, x, t] = impulse(b, a); %% -------------------------------------------------
%% Plot
%% ------------------------------------------------- figure('NumberTitle', 'off', 'Name', 'Problem 8.14 Analog Chebyshev-I lowpass')
set(gcf,'Color','white');
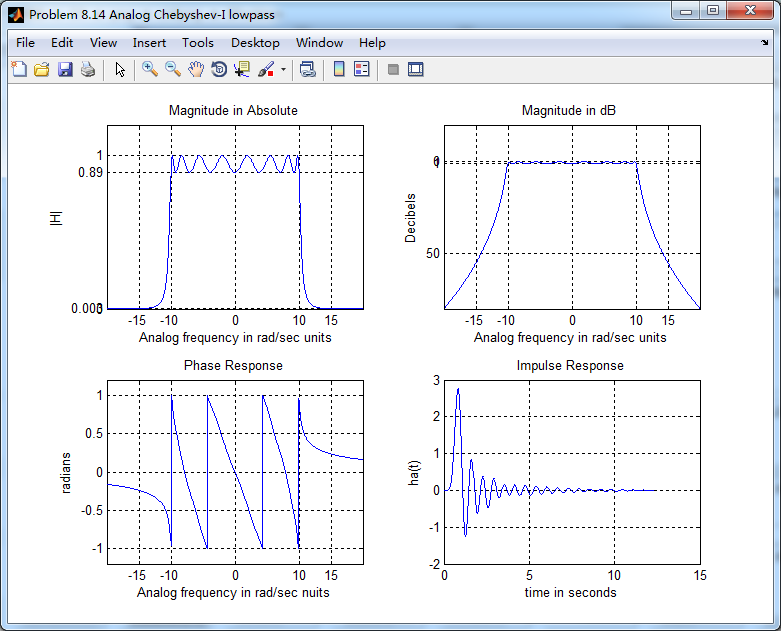
M = 1.0; % Omega max subplot(2,2,1); plot(ww, mag); grid on; axis([-20, 20, 0, 1.2]);
xlabel(' Analog frequency in rad/sec units'); ylabel('|H|'); title('Magnitude in Absolute');
set(gca, 'XTickMode', 'manual', 'XTick', [-15, -10, 0, 10, 15]);
set(gca, 'YTickMode', 'manual', 'YTick', [0, 0.003, 0.89, 1]); subplot(2,2,2); plot(ww, db); grid on; %axis([0, M, -50, 10]);
xlabel('Analog frequency in rad/sec units'); ylabel('Decibels'); title('Magnitude in dB ');
set(gca, 'XTickMode', 'manual', 'XTick', [-15, -10, 0, 10, 15]);
set(gca, 'YTickMode', 'manual', 'YTick', [-50, -1, 0]);
set(gca,'YTickLabelMode','manual','YTickLabel',['50';' 1';' 0']); subplot(2,2,3); plot(ww, pha/pi); grid on; axis([-20, 20, -1.2, 1.2]);
xlabel('Analog frequency in rad/sec nuits'); ylabel('radians'); title('Phase Response');
set(gca, 'XTickMode', 'manual', 'XTick', [-15, -10, 0, 10, 15]);
set(gca, 'YTickMode', 'manual', 'YTick', [-1:0.5:1]); subplot(2,2,4); plot(t, ha); grid on; %axis([0, 30, -0.05, 0.25]);
xlabel('time in seconds'); ylabel('ha(t)'); title('Impulse Response');
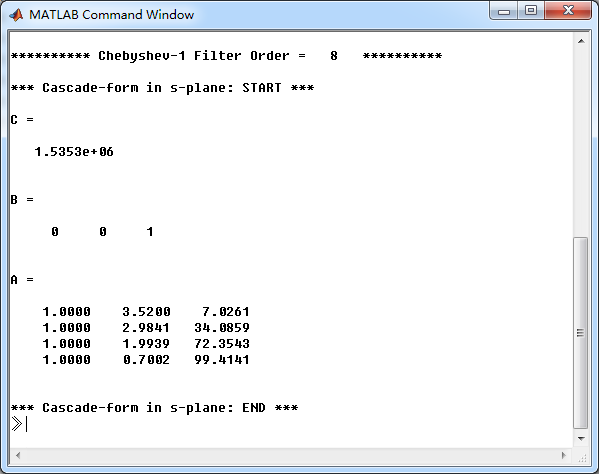
运行结果:
通带、阻带绝对指标

模拟Chebyshev-1型低通滤波器串联形式系数
幅度谱、相位谱和脉冲响应
将通带部分放大,如下图
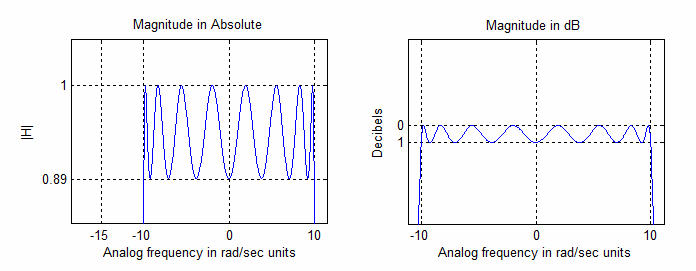
依chebyshev-1型低通特征可知,只是通带部分有振荡,图也显示了这点。
最新文章
- 使用MATLAB对图像处理的几种方法(下)
- 数据的平面拟合 Plane Fitting
- 测试内容url
- Linux vsftp配置本地用户
- JQuery 技巧积累与总结
- NABC竞争性需求分析
- SQL localdb 连接字符串
- vs2010编译lua-5.3.2
- iOS 开发--github的demo
- 使用Unity拦截一个返回Task的方法
- Android:控件ListView列表项与适配器结合使用
- NYOJ737
- jquery奇怪的问题
- Previous operation has not finished; run 'cleanup' if it was interrupted
- bootstrap-table 怎么自定义搜索按钮实现点击按钮进行查询
- Cocos2D:塔防游戏制作之旅(四)
- Java for Android 第二周课上实验一
- Tomcat 用 startup.bat 启动时,加载信息之后又关闭服务器(差不多一闪而过)问题
- Libevent源码分析系列
- [ Windows BAT Script ] 删除某个目录下的所有某类文件