wxpython绘制音频
2024-09-10 11:45:58
#-*- coding: utf-8 -*- ################################################################################
## 使用wxPython的绘图模块wxPyPlot,需要数据可视化的时候,无需再借用其他的库或模块了
################################################################################
import numpy as np
import wx
import wx.lib.plot as wxPyPlot # 导入绘图模块,并命名为wxPyPlot
import wave
import pylab as pl # 需要把数据封装进入MyDataObject中
def MyDataObject():
# 50 个点的sin函数,用蓝色圆点表示
data1 = 2.*np.pi*np.arange(100)/100.
data1.shape = (50, 2)
data1[:, 1] = np.sin(data1[:, 0])
print ("debug:", data1.shape)
markers = wxPyPlot.PolyMarker(data1, legend='Green Markers', colour='blue', marker='circle', size=1)
# 50个点的cos函数,用红色表示
data2 = 2.*np.pi*np.arange(100)/100.
data2.shape = (50, 2)
print ("debug: data2", len(data2))
data2[:, 1] = np.cos(data2[:, 0])
lines = wxPyPlot.PolySpline(data2, legend='Red Line', colour='red')
GraphTitle = "Plot Data(Sin and Cos)" return wxPyPlot.PlotGraphics([markers, lines], GraphTitle, "X Axis", "Y Axis") # 解析wav数据
def MyWavData(wav_filename=""):
print('working')
# 打开wav文档
file = wave.open("mic4.wav", "r")
# 读取格式信息
# (nchannels, sampwidth,framerate, nframes, comptype, compname)
params = file.getparams()
nchannels, sampwidth, framerate, nframes = params[:4]
print (nchannels, sampwidth, framerate, nframes)
# 读取波形数据
str_data = file.readframes(nframes)
# 文件使用完毕,关闭文件
file.close() # 将波形数据装换成数组
wave_data = np.fromstring(str_data, dtype=np.short)
wave_data.shape = (-1, 2)
wave_data = wave_data.T # 矩阵转置
time = np.arange(0, nframes) * (1.0 / framerate)
# print ("debug: time:", len(time))
# print ("debug: wave_data:", len(wave_data[0][0:len(time)]))
# print ("debug: time:", time)
# print ("debug: wave:", wave_data)
time_and_wav = np.asarray([time, wave_data[0][0:len(time)]]).T
print ("debug: len of time and wav: ", len(time_and_wav))
print ("debug: time and wav: ", time_and_wav.shape)
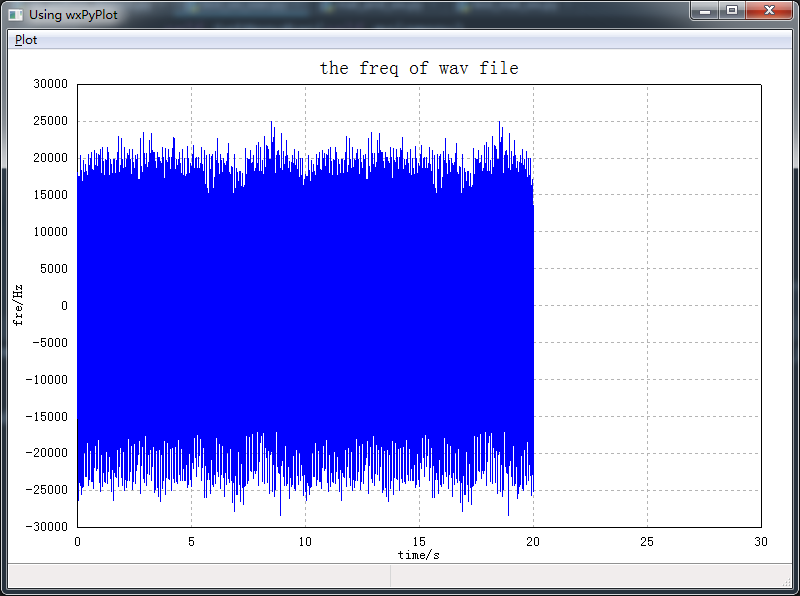
lines = wxPyPlot.PolySpline(time_and_wav, legend='Blue Line', colour='blue')
GraphTitle = "the freq of wav file"
return wxPyPlot.PlotGraphics([lines, ], GraphTitle, "time/s", "fre/Hz") class TestFrame1(wx.Frame):
def __init__(self, parent=None, id=wx.ID_ANY, title="Using wxPyPlot"):
wx.Frame.__init__(self, parent, id, title, size=(800, 600))
# 创建菜单栏
self.mainmenu = wx.MenuBar()
# 创建菜单
menu = wx.Menu()
menu.Append(100, 'Draw1', 'Draw plots1')
self.Bind(wx.EVT_MENU, self.OnPlotDraw1, id=100)
menu.Append(200, 'Draw_wav', 'Draw wav')
self.Bind(wx.EVT_MENU, self.OnPlotDraw_wav, id=200)
# 添加菜单到菜单栏
self.mainmenu.Append(menu, '&Plot')
# 设置菜单Bar
self.SetMenuBar(self.mainmenu)
# 创建状态栏,显示信息
self.CreateStatusBar(2)
self.pc = wxPyPlot.PlotCanvas(self) # 此处导入绘图面板 def OnPlotDraw1(self, event): # 绘图函数
self.pc.Draw(MyDataObject()) def OnPlotDraw_wav(self, event):
self.pc.Draw(MyWavData()) def main():
app = wx.App()
# MyWavData()
tf = TestFrame1()
tf.Show()
app.MainLoop() # 测试wxPyPlot的代码
if __name__ == '__main__':
main()
最新文章
- 让我们一起用开源数据库和开源框架废弃Access
- JavaOne_2016演讲视频:
- 关于HTML标签(元素)的那些事?
- [Tool] 使用CodeMaid自动程序排版
- POJ2823 Sliding Window (单调队列)
- sidePagination: "server"和responseHandler: responseHandler
- 什么是Nib文件?(Nib文件是一种特殊类型的资源文件,它用于保存iPhone OS或Mac OS X应用程序的用户接口)
- WEBUS2.0 In Action - 搜索操作指南 - (3)
- Netty4.x中文教程系列(二) – 白话概念
- tdx api z
- 七牛上传Qt版本
- LoadRunner 参数化详解
- redis学习研究--Redis作者谈Redis应用场景
- 代码管理git总结
- C#中的DataTable简单使用Merge
- KMP详解之二
- java各种概念 Core Java总结
- 申请JetBrains学生免费注册码
- 初始数据结构(python语言)
- 【转帖】ARM的两种不同的CPU docker 应该也是支持arm的