附014.Kubernetes Prometheus+Grafana+EFK+Kibana+Glusterfs整合性方案
2024-08-31 23:37:58
一 glusterfs存储集群部署
注意:以下为简略步骤,详情参考《附009.Kubernetes永久存储之GlusterFS独立部署》。
1.1 架构示意
略
1.2 相关规划
|
主机
|
IP
|
磁盘
|
备注
|
|
k8smaster01
|
172.24.8.71
|
——
|
Kubernetes Master节点
Heketi主机
|
|
k8smaster02
|
172.24.8.72
|
——
|
Kubernetes Master节点
Heketi主机
|
|
k8smaster03
|
172.24.8.73
|
——
|
Kubernetes Master节点
Heketi主机
|
|
k8snode01
|
172.24.8.74
|
sdb
|
Kubernetes Worker节点
glusterfs 01节点
|
|
k8snode02
|
172.24.8.75
|
sdb
|
Kubernetes Worker节点
glusterfs 02节点
|
|
k8snode03
|
172.24.8.76
|
sdb
|
Kubernetes Worker节点
glusterfs 03节点
|
提示:本规划直接使用裸磁盘完成。
1.3 安装glusterfs
# yum -y install centos-release-gluster
# yum -y install glusterfs-server
# systemctl start glusterd
# systemctl enable glusterd
提示:建议所有节点安装。
1.4 添加信任池
[root@k8snode01 ~]# gluster peer probe k8snode02
[root@k8snode01 ~]# gluster peer probe k8snode03
[root@k8snode01 ~]# gluster peer status #查看信任池状态
[root@k8snode01 ~]# gluster pool list #查看信任池列表
提示:仅需要在glusterfs任一节点执行一次即可。
1.5 安装heketi
[root@k8smaster01 ~]# yum -y install heketi heketi-client
1.6 配置heketi
[root@k8smaster01 ~]# vi /etc/heketi/heketi.json
 {

   "_port_comment": "Heketi Server Port Number",

   "port": "",

   "_use_auth": "Enable JWT authorization. Please enable for deployment",

   "use_auth": true,

   "_jwt": "Private keys for access",

   "jwt": {

     "_admin": "Admin has access to all APIs",

     "admin": {

       "key": "admin123"

     },

     "_user": "User only has access to /volumes endpoint",

     "user": {

       "key": "xianghy"

     }

   },

   "_glusterfs_comment": "GlusterFS Configuration",

   "glusterfs": {

     "_executor_comment": [

       "Execute plugin. Possible choices: mock, ssh",

       "mock: This setting is used for testing and development.",

       "      It will not send commands to any node.",

       "ssh:  This setting will notify Heketi to ssh to the nodes.",

       "      It will need the values in sshexec to be configured.",

       "kubernetes: Communicate with GlusterFS containers over",

       "            Kubernetes exec api."

     ],

     "executor": "ssh",

     "_sshexec_comment": "SSH username and private key file information",

     "sshexec": {

       "keyfile": "/etc/heketi/heketi_key",

       "user": "root",

       "port": "",

       "fstab": "/etc/fstab"

     },

     "_db_comment": "Database file name",

     "db": "/var/lib/heketi/heketi.db",

     "_loglevel_comment": [

       "Set log level. Choices are:",

       "  none, critical, error, warning, info, debug",

       "Default is warning"

     ],

     "loglevel" : "warning"

   }

 }
1.7 配置免秘钥
[root@k8smaster01 ~]# ssh-keygen -t rsa -q -f /etc/heketi/heketi_key -N ""
[root@k8smaster01 ~]# chown heketi:heketi /etc/heketi/heketi_key
[root@k8smaster01 ~]# ssh-copy-id -i /etc/heketi/heketi_key.pub root@k8snode01
[root@k8smaster01 ~]# ssh-copy-id -i /etc/heketi/heketi_key.pub root@k8snode02
[root@k8smaster01 ~]# ssh-copy-id -i /etc/heketi/heketi_key.pub root@k8snode03
1.8 启动heketi
[root@k8smaster01 ~]# systemctl enable heketi.service
[root@k8smaster01 ~]# systemctl start heketi.service
[root@k8smaster01 ~]# systemctl status heketi.service
[root@k8smaster01 ~]# curl http://localhost:8080/hello #测试访问
1.9 配置Heketi拓扑
[root@k8smaster01 ~]# vi /etc/heketi/topology.json
 {

   "clusters": [

     {

       "nodes": [

         {

           "node": {

             "hostnames": {

               "manage": [

                 "k8snode01"

               ],

               "storage": [

                 "172.24.8.74"

               ]

             },

             "zone": 1

           },

           "devices": [

             "/dev/sdb"

           ]

         },

         {

           "node": {

             "hostnames": {

               "manage": [

                 "k8snode02"

               ],

               "storage": [

                 "172.24.8.75"

               ]

             },

             "zone": 1

           },

           "devices": [

             "/dev/sdb"

           ]

         },

         {

           "node": {

             "hostnames": {

               "manage": [

                 "k8snode03"

               ],

               "storage": [

                 "172.24.8.76"

               ]

             },

             "zone": 1

           },

           "devices": [

             "/dev/sdb"

           ]

         }

       ]

     }

   ]

 }
[root@k8smaster01 ~]# echo "export HEKETI_CLI_SERVER=http://k8smaster01:8080" >> /etc/profile.d/heketi.sh
[root@k8smaster01 ~]# echo "alias heketi-cli='heketi-cli --user admin --secret admin123'" >> .bashrc
[root@k8smaster01 ~]# source /etc/profile.d/heketi.sh
[root@k8smaster01 ~]# source .bashrc
[root@k8smaster01 ~]# echo $HEKETI_CLI_SERVER
http://k8smaster01:8080
[root@k8smaster01 ~]# heketi-cli --server $HEKETI_CLI_SERVER --user admin --secret admin123 topology load --json=/etc/heketi/topology.json
1.10 集群管理及测试
[root@heketi ~]# heketi-cli cluster list #集群列表
[root@heketi ~]# heketi-cli node list #卷信息
[root@heketi ~]# heketi-cli volume list #卷信息
[root@k8snode01 ~]# gluster volume info #通过glusterfs节点查看
1.11 创建StorageClass
[root@k8smaster01 study]# vi heketi-secret.yaml
 apiVersion: v1

 kind: Secret

 metadata:

   name: heketi-secret

   namespace: heketi

 data:

   key: YWRtaW4xMjM=

 type: kubernetes.io/glusterfs
[root@k8smaster01 study]# kubectl create ns heketi
[root@k8smaster01 study]# kubectl create -f heketi-secret.yaml #创建heketi
[root@k8smaster01 study]# kubectl get secrets -n heketi
[root@k8smaster01 study]# vim gluster-heketi-storageclass.yaml #正式创建StorageClass
 apiVersion: storage.k8s.io/v1

 kind: StorageClass

 metadata:

   name: ghstorageclass

 parameters:

   resturl: "http://172.24.8.71:8080"

   clusterid: "ad0f81f75f01d01ebd6a21834a2caa30"

   restauthenabled: "true"

   restuser: "admin"

   secretName: "heketi-secret"

   secretNamespace: "heketi"

   volumetype: "replicate:3"

 provisioner: kubernetes.io/glusterfs

 reclaimPolicy: Delete
[root@k8smaster01 study]# kubectl create -f gluster-heketi-storageclass.yaml
注意:storageclass资源创建后不可变更,如修改只能删除后重建。
[root@k8smaster01 heketi]# kubectl get storageclasses #查看确认
NAME PROVISIONER AGE
gluster-heketi-storageclass kubernetes.io/glusterfs 85s
[root@k8smaster01 heketi]# kubectl describe storageclasses ghstorageclass
二 集群监控Metrics
注意:以下为简略步骤,详情参考《049.集群管理-集群监控Metrics》。
2.1 开启聚合层
开机聚合层功能,使用kubeadm默认已开启此功能,可如下查看验证。
[root@k8smaster01 ~]# cat /etc/kubernetes/manifests/kube-apiserver.yaml
2.2 获取部署文件
[root@k8smaster01 ~]# git clone https://github.com/kubernetes-incubator/metrics-server.git
[root@k8smaster01 ~]# cd metrics-server/deploy/1.8+/
[root@k8smaster01 1.8+]# vi metrics-server-deployment.yaml
 ……

         image: mirrorgooglecontainers/metrics-server-amd64:v0.3.6	#修改为国内源

         command:

         - /metrics-server

         - --metric-resolution=30s

         - --kubelet-insecure-tls

         - --kubelet-preferred-address-types=InternalIP,Hostname,InternalDNS,ExternalDNS,ExternalIP	#添加如上command

 ……
2.3 正式部署
[root@k8smaster01 1.8+]# kubectl apply -f .
[root@k8smaster01 1.8+]# kubectl -n kube-system get pods -l k8s-app=metrics-server
[root@k8smaster01 1.8+]# kubectl -n kube-system logs -l k8s-app=metrics-server -f #可查看部署日志
2.4 确认验证
[root@k8smaster01 ~]# kubectl top nodes
[root@k8smaster01 ~]# kubectl top pods --all-namespaces
三 Prometheus部署
注意:以下为简略步骤,详情参考《050.集群管理-Prometheus+Grafana监控方案》。
3.1 获取部署文件
[root@k8smaster01 ~]# git clone https://github.com/prometheus/prometheus
3.2 创建命名空间
[root@k8smaster01 ~]# cd prometheus/documentation/examples/
[root@k8smaster01 examples]# vi monitor-namespace.yaml
 apiVersion: v1

 kind: Namespace

 metadata:

   name: monitoring
[root@k8smaster01 examples]# kubectl create -f monitor-namespace.yaml
3.3 创建RBAC
[root@k8smaster01 examples]# vi rbac-setup.yml
 apiVersion: rbac.authorization.k8s.io/v1beta1

 kind: ClusterRole

 metadata:

   name: prometheus

 rules:

 - apiGroups: [""]

   resources:

   - nodes

   - nodes/proxy

   - services

   - endpoints

   - pods

   verbs: ["get", "list", "watch"]

 - apiGroups:

   - extensions

   resources:

   - ingresses

   verbs: ["get", "list", "watch"]

 - nonResourceURLs: ["/metrics"]

   verbs: ["get"]

 ---

 apiVersion: v1

 kind: ServiceAccount

 metadata:

   name: prometheus

   namespace: monitoring               #仅需修改命名空间

 ---

 apiVersion: rbac.authorization.k8s.io/v1beta1

 kind: ClusterRoleBinding

 metadata:

   name: prometheus

 roleRef:

   apiGroup: rbac.authorization.k8s.io

   kind: ClusterRole

   name: prometheus

 subjects:

 - kind: ServiceAccount

   name: prometheus

   namespace: monitoring              #仅需修改命名空间
[root@k8smaster01 examples]# kubectl create -f rbac-setup.yml
3.4 创建Prometheus ConfigMap
[root@k8smaster01 examples]# cat prometheus-kubernetes.yml | grep -v ^$ | grep -v "#" >> prometheus-config.yaml
[root@k8smaster01 examples]# vi prometheus-config.yaml
 apiVersion: v1

 kind: ConfigMap

 metadata:

   name: prometheus-server-conf

   labels:

     name: prometheus-server-conf

   namespace: monitoring               #修改命名空间

 ……
[root@k8smaster01 examples]# kubectl create -f prometheus-config.yaml
3.5 创建持久PVC
[root@k8smaster01 examples]# vi prometheus-pvc.yaml
 apiVersion: v1

 kind: PersistentVolumeClaim

 metadata:

   name: prometheus-pvc

   namespace: monitoring

   annotations:

     volume.beta.kubernetes.io/storage-class: ghstorageclass

 spec:

   accessModes:

   - ReadWriteMany

   resources:

     requests:

       storage: 5Gi
[root@k8smaster01 examples]# kubectl create -f prometheus-pvc.yaml
3.6 Prometheus部署
[root@k8smaster01 examples]# vi prometheus-deployment.yml
 apiVersion: apps/v1beta2

 kind: Deployment

 metadata:

   labels:

     name: prometheus-deployment

   name: prometheus-server

   namespace: monitoring

 spec:

   replicas: 1

   selector:

     matchLabels:

       app: prometheus-server

   template:

     metadata:

       labels:

         app: prometheus-server

     spec:

       containers:

         - name: prometheus-server

           image: prom/prometheus:v2.14.0

           command:

           - "/bin/prometheus"

           args:

             - "--config.file=/etc/prometheus/prometheus.yml"

             - "--storage.tsdb.path=/prometheus/"

             - "--storage.tsdb.retention=72h"

           ports:

             - containerPort: 9090

               protocol: TCP

           volumeMounts:

             - name: prometheus-config-volume

               mountPath: /etc/prometheus/

             - name: prometheus-storage-volume

               mountPath: /prometheus/

       serviceAccountName: prometheus

       imagePullSecrets:

         - name: regsecret

       volumes:

         - name: prometheus-config-volume

           configMap:

             defaultMode: 420

             name: prometheus-server-conf

         - name: prometheus-storage-volume

           persistentVolumeClaim:

             claimName: prometheus-pvc
[root@k8smaster01 examples]# kubectl create -f prometheus-deployment.yml
3.7 创建Prometheus Service
[root@k8smaster01 examples]# vi prometheus-service.yaml
 apiVersion: v1

 kind: Service

 metadata:

   labels:

     app: prometheus-service

   name: prometheus-service

   namespace: monitoring

 spec:

   type: NodePort

   selector:

     app: prometheus-server

   ports:

     - port: 9090

       targetPort: 9090

       nodePort: 30001
[root@k8smaster01 examples]# kubectl create -f prometheus-service.yaml
[root@k8smaster01 examples]# kubectl get all -n monitoring
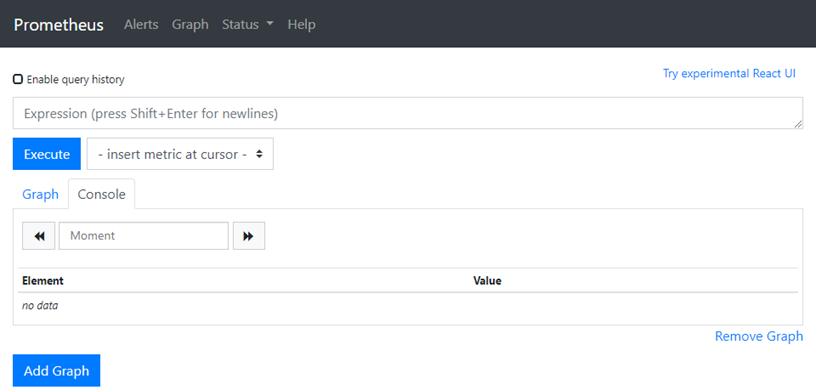
3.8 确认验证Prometheus
浏览器直接访问:http://172.24.8.100:30001/
四 部署grafana
注意:以下为简略步骤,详情参考《050.集群管理-Prometheus+Grafana监控方案》。
4.1 获取部署文件
[root@k8smaster01 ~]# git clone https://github.com/liukuan73/kubernetes-addons
[root@k8smaster01 ~]# cd /root/kubernetes-addons/monitor/prometheus+grafana
4.2 创建持久PVC
[root@k8smaster01 prometheus+grafana]# vi grafana-data-pvc.yaml
 apiVersion: v1

 kind: PersistentVolumeClaim

 metadata:

   name: grafana-data-pvc

   namespace: monitoring

   annotations:

     volume.beta.kubernetes.io/storage-class: ghstorageclass

 spec:

   accessModes:

   - ReadWriteOnce

   resources:

     requests:

       storage: 5Gi
[root@k8smaster01 prometheus+grafana]# kubectl create -f grafana-data-pvc.yaml
4.3 grafana部署
[root@k8smaster01 prometheus+grafana]# vi grafana.yaml
 apiVersion: extensions/v1beta1

 kind: Deployment

 metadata:

   name: monitoring-grafana

   namespace: monitoring

 spec:

   replicas: 1

   template:

     metadata:

       labels:

         task: monitoring

         k8s-app: grafana

     spec:

       containers:

       - name: grafana

         image: grafana/grafana:6.5.0

         imagePullPolicy: IfNotPresent

         ports:

         - containerPort: 3000

           protocol: TCP

         volumeMounts:

         - mountPath: /var/lib/grafana

           name: grafana-storage

         env:

           - name: INFLUXDB_HOST

             value: monitoring-influxdb

           - name: GF_SERVER_HTTP_PORT

             value: ""

           - name: GF_AUTH_BASIC_ENABLED

             value: "false"

           - name: GF_AUTH_ANONYMOUS_ENABLED

             value: "true"

           - name: GF_AUTH_ANONYMOUS_ORG_ROLE

             value: Admin

           - name: GF_SERVER_ROOT_URL

             value: /

         readinessProbe:

           httpGet:

             path: /login

             port: 3000

       volumes:

       - name: grafana-storage

         persistentVolumeClaim:

           claimName: grafana-data-pvc

       nodeSelector:

         node-role.kubernetes.io/master: "true"

       tolerations:

       - key: "node-role.kubernetes.io/master"

         effect: "NoSchedule"

 ---

 apiVersion: v1

 kind: Service

 metadata:

   labels:

     kubernetes.io/cluster-service: 'true'

     kubernetes.io/name: monitoring-grafana

   annotations:

     prometheus.io/scrape: 'true'

     prometheus.io/tcp-probe: 'true'

     prometheus.io/tcp-probe-port: '80'

   name: monitoring-grafana

   namespace: monitoring

 spec:

   type: NodePort

   ports:

   - port: 80

     targetPort: 3000

     nodePort: 30002

   selector:

     k8s-app: grafana
[root@k8smaster01 prometheus+grafana]# kubectl label nodes k8smaster01 node-role.kubernetes.io/master=true
[root@k8smaster01 prometheus+grafana]# kubectl label nodes k8smaster02 node-role.kubernetes.io/master=true
[root@k8smaster01 prometheus+grafana]# kubectl label nodes k8smaster03 node-role.kubernetes.io/master=true
[root@k8smaster01 prometheus+grafana]# kubectl create -f grafana.yaml
[root@k8smaster01 examples]# kubectl get all -n monitoring
4.4 确认验证Prometheus
浏览器直接访问:http://172.24.8.100:30002/
4.4 grafana配置
- 添加数据源:略
- 创建用户:略
提示:所有grafana配置可配置参考:https://grafana.com/docs/grafana/latest/installation/configuration/。
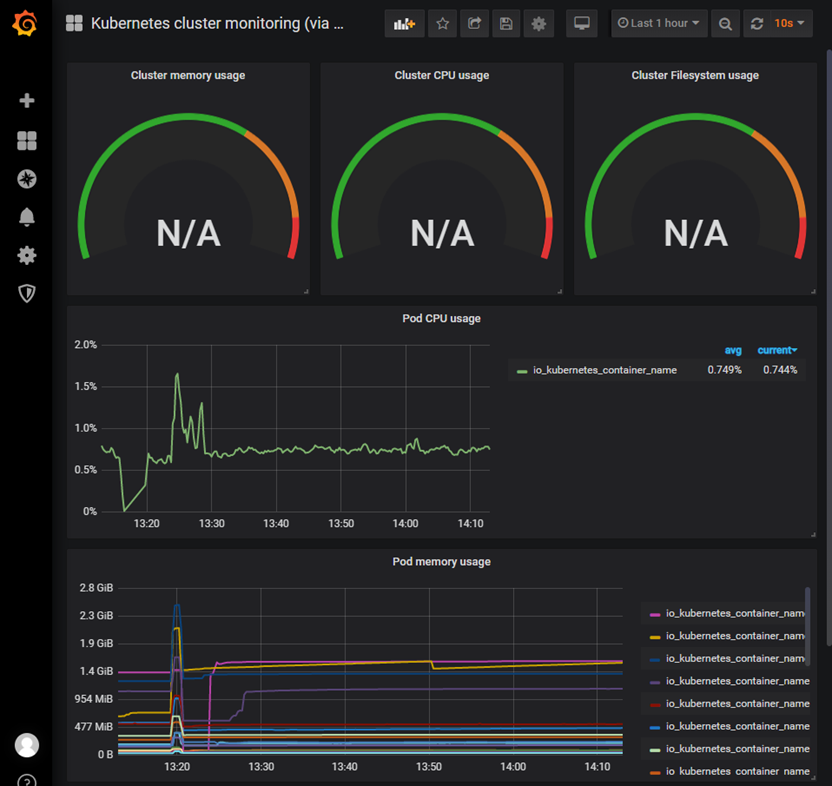
4.5 查看监控
浏览器再次访问:http://172.24.8.100:30002/
最新文章
- C#中的Session
- WINDOW(单调队列的应用)
- 利用SVN进行任意文件对比
- jsp,OGNL调用后台Action的某方法
- MANIFEST.INF!JAR规范中
- Codeforces Round #278 (Div. 2)
- Android App测试要点
- bzoj 2656 [Zjoi2012]数列(sequence)(高精度)
- CI引入外部javascript和css
- MYSQ提高L查询效率的策略总结
- EL(表达式语言)
- php 手动搭建环境
- 【WPF】学习笔记(三)——这个家伙跟电子签名板有个约定
- 开发一个Servlet示例
- java多线程设计模式
- HTTP请求的header头解析
- 安装Spotlight On Unix监控Linux
- Swift 模式匹配
- super的使用方法与使用范围
- Word图片上传控件卸载教程-Xproer.WordPaster