用Echarts实现SpreadJS引用从属关系可视化
2024-09-08 00:11:09
在金融行业,我们经常会有审计审查的需求,对某个计算结果进行审查,但是这个计算结果可能依赖多个单元格,而且会有会有多级依赖的情况,如果让我们的从业人员靠眼睛找,工作量巨大,而且准确性存疑,基本上死路一条,因此让整个审查过程可视化,迫在眉睫,现在我们利用纯前端表格和Echarts将审计审查过程可视化
一.首先我们先了解一下前端表格或Excel中引用和从属关系:
1.在单元格B1中设置公式 =SUM(A1)。 单元格A1是单元格B1的引用单元格(引用关系)
2.在单元格B1中设置公式 =SUM(A1)。 单元格B1是单元格A1的从属单元格(从属关系)
二.接下来我们看一下最终实现效果:
1.引用关系

2.从属关系
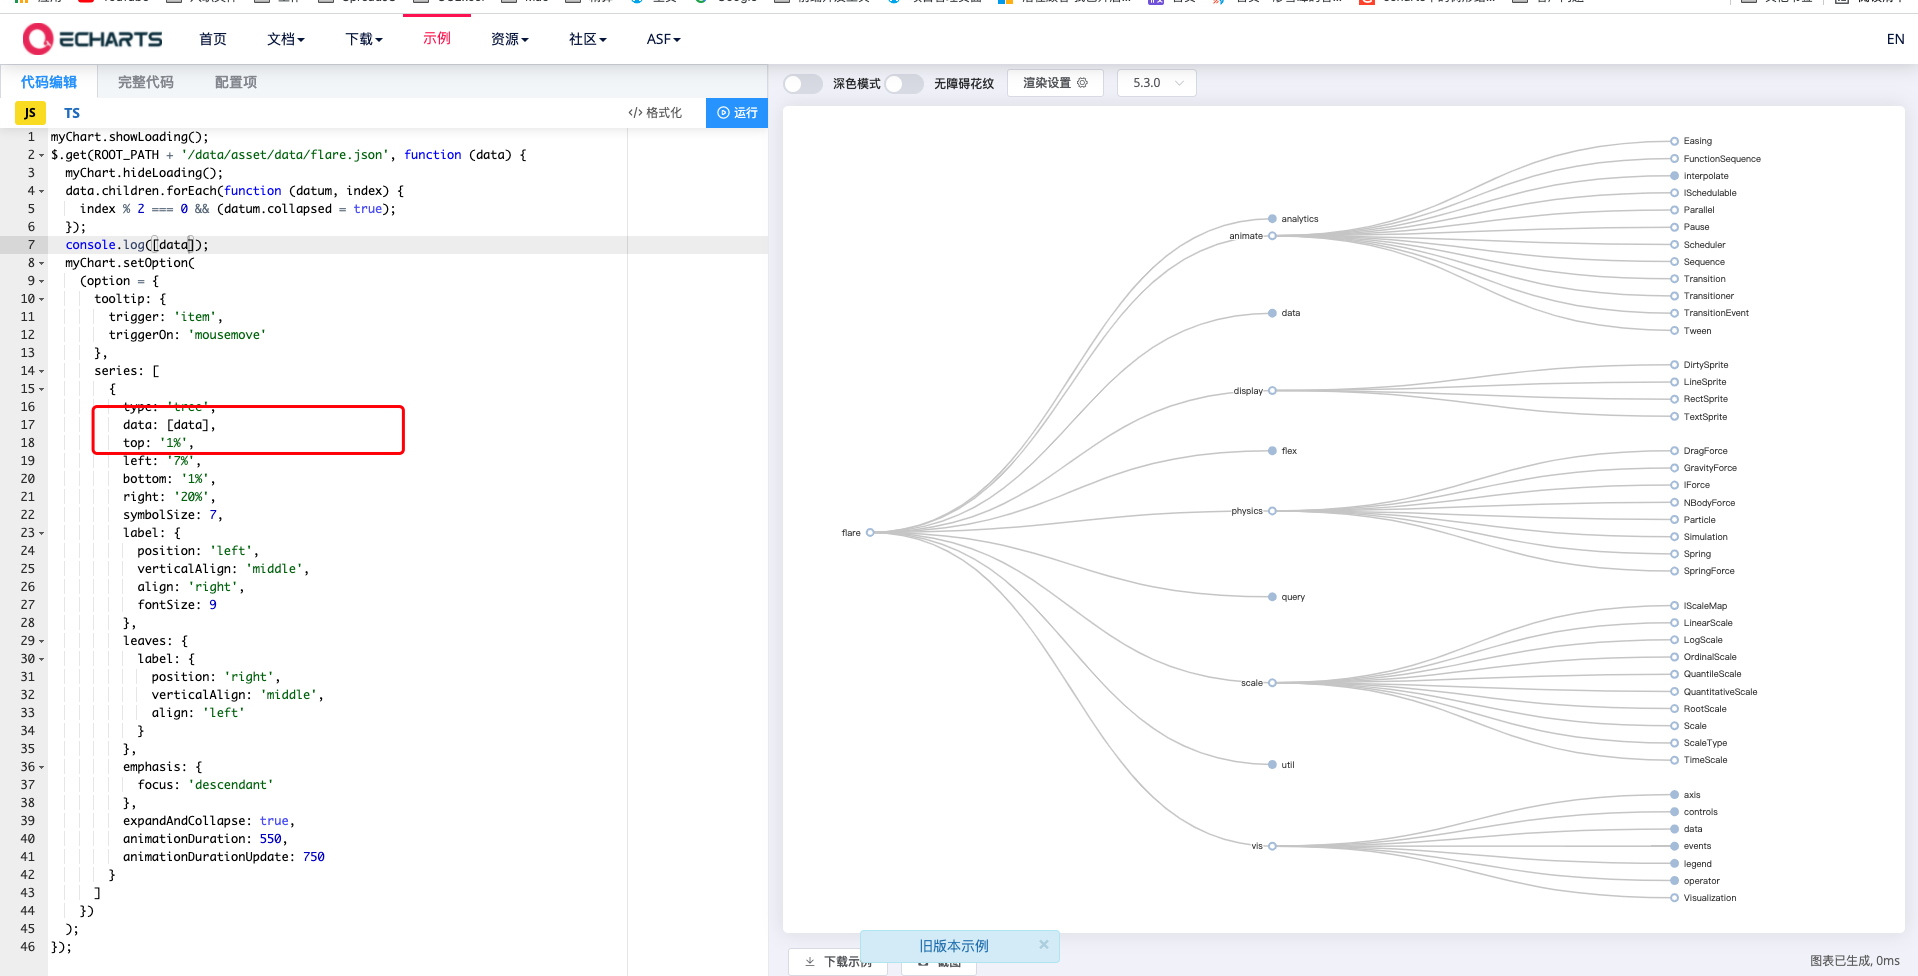
三.本次我们用的是Echarts的树图将引用和从属关系可视化,关于Echarts上手,大家去Echarts官网有完整上手教程,Echarts社区有很多开发者做的许多有趣又实用的demo,这里我们用的是树图
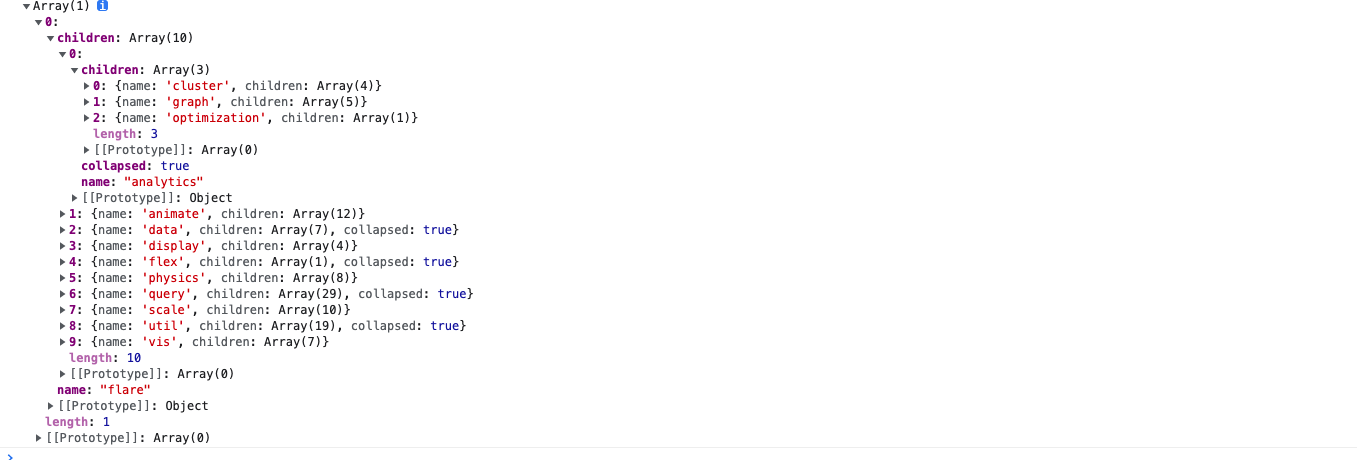
四.接下来我们要用纯前端表格控件的获取引用和从属关系的api将某个单元格的引用和从属关系顺藤摸瓜,刨根问题,刨到“祖坟”上,将这些关系,构造成Echarts树图的data结构,废话不说,直接上核心代码
// 递归构建追踪树

    buildNodeTreeAndPaint = (spreadSource, trackCellInfo) => {

        let info = this.getCellInfo(trackCellInfo);

        let sheetSource = spreadSource.getSheetFromName(info.sheetName);

        // 创建跟节点

        let rootNode = this.creatNode(info.row, info.col, sheetSource, 0, "");

        let name = rootNode.sheetName + "*" + rootNode.row + "*" + rootNode.col + "*" + Math.random().toString();

        let precedentsRootNode = '';

        let dependentsRootNode = '';

        if (this.state.trackType === "Precedents" || this.state.trackType === "Both") {

            this.getNodeChild(rootNode, sheetSource, "Precedents")

            debugger;

            console.log(rootNode)

            if (this.state.trackType === "Both") {

                let rootNodeChildren = JSON.parse(JSON.stringify(rootNode.children));

                rootNode.children = [];

                precedentsRootNode = JSON.parse(JSON.stringify(rootNode));

                precedentsRootNode.children.push({

                    name: "Precedents",

                    value: "Precedents",

                    children: rootNodeChildren

                })

                this.setState({

                    precedentsRootNode: JSON.parse(JSON.stringify(precedentsRootNode)),

                })

            }

        }

        if (this.state.trackType === "Dependents" || this.state.trackType === "Both") {

            this.getNodeChild(rootNode, sheetSource, "Dependents")

            console.log(rootNode)

            if (this.state.trackType === "Both") {

                let deepInfo = [1];

                let rootNodeChildren = JSON.parse(JSON.stringify(rootNode.children));

                rootNode.children = [];

                dependentsRootNode = JSON.parse(JSON.stringify(rootNode));

                dependentsRootNode.children.push({

                    name: "Dependents",

                    value: "Dependents",

                    children: rootNodeChildren

                })

                this.setState({

                    dependentsRootNode: JSON.parse(JSON.stringify(dependentsRootNode)),

                })

            }

        }

        if (this.state.trackType === "Both") {

            precedentsRootNode.children = precedentsRootNode.children.concat(dependentsRootNode.children);

            // let bothRootNode = precedentsRootNode.children[0].children.concat(dependentsRootNode.children[0].children)

            this.setState({

                rootNode1: JSON.parse(JSON.stringify(precedentsRootNode)),

            })

        } else {

            this.setState({

                rootNode1: JSON.parse(JSON.stringify(rootNode)),

            })

        }

    }

    creatNode = (row, col, sheet, deep, trackType) => {

        let node = {

            value: sheet.getValue(row, col),

            position: sheet.name() + "!" + GC.Spread.Sheets.CalcEngine.rangeToFormula(new GC.Spread.Sheets.Range(row, col, 1, 1)),

            deep: deep,

            name: `${sheet.name()}!${GC.Spread.Sheets.CalcEngine.rangeToFormula(new GC.Spread.Sheets.Range(row, col, 1, 1))}\nvalue:${sheet.getValue(row, col)}`,

            sheetName: sheet.name(),

            row: row,

            col: col,

            trackType: trackType

        };

        return node;

    }

    getNodeChild = (rootNode, sheet, trackType) => {

        let childNodeArray = [];

        let children = [];

        let row = rootNode.row, col = rootNode.col, deep = rootNode.deep;

        if (trackType == "Precedents") {

            children = sheet.getPrecedents(row, col);

        }

        else {

            children = sheet.getDependents(row, col);

        }

        // let self = this;

        if (children.length >= 1) {

            children.forEach((node) => {

                let row = node.row,

                    col = node.col,

                    rowCount = node.rowCount,

                    colCount = node.colCount,

                    _sheet = sheet.parent.getSheetFromName(node.sheetName);

                if (rowCount > 1 || colCount > 1) {

                    for (let r = row; r < row + rowCount; r++) {

                        for (let c = col; c < col + colCount; c++) {

                            let newNode = this.creatNode(r, c, _sheet, deep + 1, trackType)

                            // if (deep < self.maxDeep) {

                            this.getNodeChild(newNode, _sheet, trackType);

                            // }

                            childNodeArray.push(newNode);

                        }

                    }

                } else {

                    let newNode = this.creatNode(row, col, _sheet, deep + 1, trackType)

                    // if (deep < self.maxDeep) {

                    this.getNodeChild(newNode, _sheet, trackType);

                    // }

                    childNodeArray.push(newNode);

                }

            });

        }

        rootNode.children = childNodeArray;

    }
五.将构造好的引用和从属树rootNode在Echarts中渲染
myChart.setOption(

            (option = {

                tooltip: {

                    trigger: 'item',

                    triggerOn: 'mousemove'

                },

                series: [

                    {

                        type: 'tree',

                        data: [this.state.rootNode1],

                        top: '1%',

                        left: '15%',

                        bottom: '1%',

                        right: '7%',

                        symbolSize: 10,

                        orient: this.state.trackType === 'review'?'LR':'RL',

                        label: {

                            position: this.state.trackType === 'review'?'left':'right',

                            verticalAlign: 'middle',

                            align: this.state.trackType === 'review'?'right':'left',

                        },

                        leaves: {

                            label: {

                                position: this.state.trackType === 'review'?'right':'left',

                                verticalAlign: 'middle',

                                align: this.state.trackType === 'review'?'left':'right'

                            }

                        },

                        emphasis: {

                            focus: 'descendant'

                        },

                        // layout: 'radial',

                        expandAndCollapse: true,

                        animationDuration: 550,

                        animationDurationUpdate: 750

                    }

                ]

            })

        );

        option && myChart.setOption(option);
以上就是实现报表中公式引用从属关系Echarts可视化的核心实现逻辑,由于工程较大,需要完整内容可以留言。。
拓展阅读
React + Springboot + Quartz,从0实现Excel报表自动化
使用纯前端类Excel表格控件SpreadJS构建企业现金流量表
最新文章
- ASP.NET MVC5 网站开发实践(二) Member区域–我的咨询列表及添加咨询
- IIS下配置PHP
- log4Net不能成功生成日志问题(关于配置错误)
- Extract Fasta Sequences Sub Sets by position
- MyBatis环境搭建配置文件+入门视频下载
- javascript与服务器3
- 求一元二次方程ax^2+bx+c=0的解
- 【M13】以by reference 方式捕捉exceptions
- DropDownList控件学习
- jQuery插件的编写相关技术 设计总结和最佳实践
- [其他]win7下chrome浏览器插件导出与导入
- 关于UI_USER_INTERFACE_IDIOM() & UIDevice.model
- 201521123078 《java程序设计》第十周学习总结
- pep 8 规范的一些记录
- cordova插件新的窗口实例打开连接: cordova-plugin-inappbrowser
- [angularjs] angularjs系列笔记(八)事件
- Windows Server 2008 R2微软官方下载
- Thinkphp中import的几个用法详细介绍
- event.keyCode与event.which
- apache中 MaxClients 与MaxRequestsPerChild