吴裕雄--天生自然 R语言开发学习:高级数据管理(续三)
2024-08-30 07:00:21


#-----------------------------------#
# R in Action (2nd ed): Chapter 5 #
# Advanced data management #
# requires that the reshape2 #
# package has been installed #
# install.packages("reshape2") #
#-----------------------------------# # Class Roster Dataset
Student <- c("John Davis","Angela Williams","Bullwinkle Moose",
"David Jones","Janice Markhammer",
"Cheryl Cushing","Reuven Ytzrhak",
"Greg Knox","Joel England","Mary Rayburn")
math <- c(502, 600, 412, 358, 495, 512, 410, 625, 573, 522)
science <- c(95, 99, 80, 82, 75, 85, 80, 95, 89, 86)
english <- c(25, 22, 18, 15, 20, 28, 15, 30, 27, 18)
roster <- data.frame(Student, math, science, english,
stringsAsFactors=FALSE) # Listing 5.1 - Calculating the mean and standard deviation
x <- c(1, 2, 3, 4, 5, 6, 7, 8)
mean(x)
sd(x)
n <- length(x)
meanx <- sum(x)/n
css <- sum((x - meanx)**2)
sdx <- sqrt(css / (n-1))
meanx
sdx # Listing 5.2 - Generating pseudo-random numbers from
# a uniform distribution
runif(5)
runif(5)
set.seed(1234)
runif(5)
set.seed(1234)
runif(5) # Listing 5.3 - Generating data from a multivariate
# normal distribution
library(MASS)
mean <- c(230.7, 146.7, 3.6)
sigma <- matrix( c(15360.8, 6721.2, -47.1,
6721.2, 4700.9, -16.5,
-47.1, -16.5, 0.3), nrow=3, ncol=3)
set.seed(1234)
mydata <- mvrnorm(500, mean, sigma)
mydata <- as.data.frame(mydata)
names(mydata) <- c("y", "x1", "x2")
dim(mydata)
head(mydata, n=10) # Listing 5.4 - Applying functions to data objects
a <- 5
sqrt(a)
b <- c(1.243, 5.654, 2.99)
round(b)
c <- matrix(runif(12), nrow=3)
c
log(c)
mean(c) # Listing 5.5 - Applying a function to the rows (columns) of a matrix
mydata <- matrix(rnorm(30), nrow=6)
mydata
apply(mydata, 1, mean)
apply(mydata, 2, mean)
apply(mydata, 2, mean, trim=.4) # Listing 5.6 - A solution to the learning example
options(digits=2)
Student <- c("John Davis", "Angela Williams", "Bullwinkle Moose",
"David Jones", "Janice Markhammer", "Cheryl Cushing",
"Reuven Ytzrhak", "Greg Knox", "Joel England",
"Mary Rayburn")
Math <- c(502, 600, 412, 358, 495, 512, 410, 625, 573, 522)
Science <- c(95, 99, 80, 82, 75, 85, 80, 95, 89, 86)
English <- c(25, 22, 18, 15, 20, 28, 15, 30, 27, 18) roster <- data.frame(Student, Math, Science, English,
stringsAsFactors=FALSE) z <- scale(roster[,2:4])
score <- apply(z, 1, mean)
roster <- cbind(roster, score) y <- quantile(score, c(.8,.6,.4,.2))
roster$grade[score >= y[1]] <- "A"
roster$grade[score < y[1] & score >= y[2]] <- "B"
roster$grade[score < y[2] & score >= y[3]] <- "C"
roster$grade[score < y[3] & score >= y[4]] <- "D"
roster$grade[score < y[4]] <- "F" name <- strsplit((roster$Student), " ")
Lastname <- sapply(name, "[", 2)
Firstname <- sapply(name, "[", 1)
roster <- cbind(Firstname,Lastname, roster[,-1])
roster <- roster[order(Lastname,Firstname),] roster # Listing 5.4 - A switch example
feelings <- c("sad", "afraid")
for (i in feelings)
print(
switch(i,
happy = "I am glad you are happy",
afraid = "There is nothing to fear",
sad = "Cheer up",
angry = "Calm down now"
)
) # Listing 5.5 - mystats(): a user-written function for
# summary statistics
mystats <- function(x, parametric=TRUE, print=FALSE) {
if (parametric) {
center <- mean(x); spread <- sd(x)
} else {
center <- median(x); spread <- mad(x)
}
if (print & parametric) {
cat("Mean=", center, "\n", "SD=", spread, "\n")
} else if (print & !parametric) {
cat("Median=", center, "\n", "MAD=", spread, "\n")
}
result <- list(center=center, spread=spread)
return(result)
} # trying it out
set.seed(1234)
x <- rnorm(500)
y <- mystats(x)
y <- mystats(x, parametric=FALSE, print=TRUE) # mydate: a user-written function using switch
mydate <- function(type="long") {
switch(type,
long = format(Sys.time(), "%A %B %d %Y"),
short = format(Sys.time(), "%m-%d-%y"),
cat(type, "is not a recognized type\n"))
}
mydate("long")
mydate("short")
mydate()
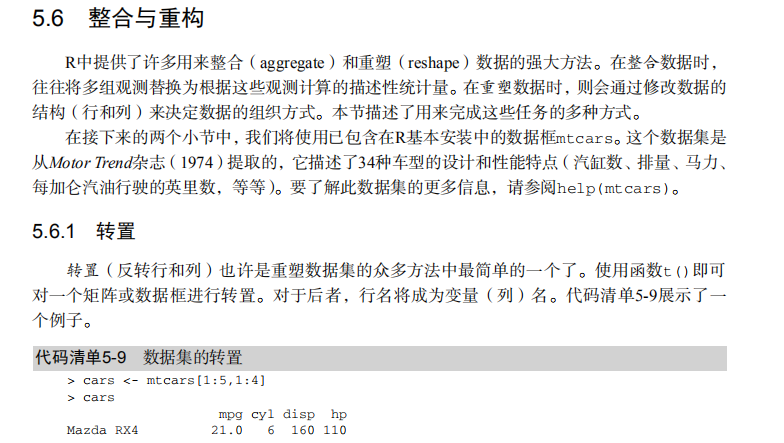
mydate("medium") # Listing 5.9 - Transposing a dataset
cars <- mtcars[1:5, 1:4]
cars
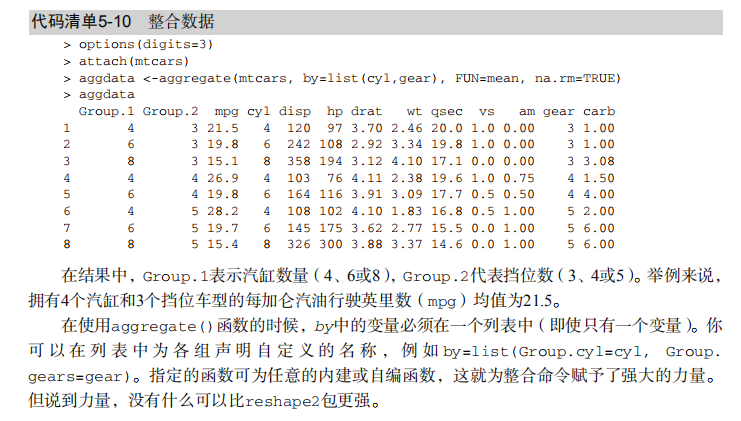
t(cars) # Listing 5.10 - Aggregating data
options(digits=3)
attach(mtcars)
aggdata <-aggregate(mtcars, by=list(cyl,gear),
FUN=mean, na.rm=TRUE)
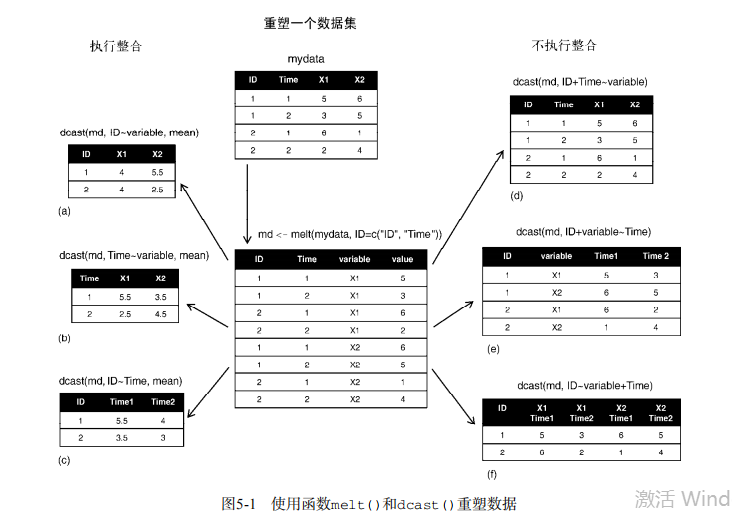
aggdata # Using the reshape2 package
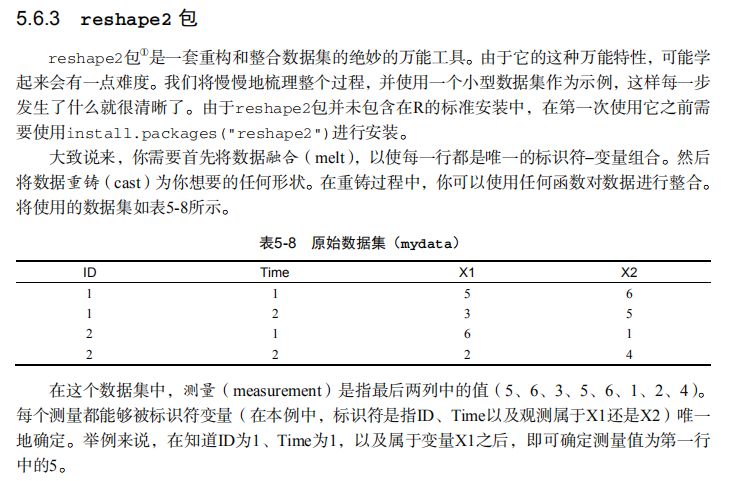
library(reshape2) # input data
mydata <- read.table(header=TRUE, sep=" ", text="
ID Time X1 X2
1 1 5 6
1 2 3 5
2 1 6 1
2 2 2 4
") # melt data
md <- melt(mydata, id=c("ID", "Time")) # reshaping with aggregation
dcast(md, ID~variable, mean)
dcast(md, Time~variable, mean)
dcast(md, ID~Time, mean) # reshaping without aggregation
dcast(md, ID+Time~variable)
dcast(md, ID+variable~Time)
dcast(md, ID~variable+Time)
最新文章
- 机器指令翻译成 JavaScript —— 终极目标
- Win10 磁盘占用 100% 有效解决办法
- 《JavaScript高级程序设计》读书笔记--(2)基本概念
- CGContextAddCurveToPoint 的深入理解
- 2016-08-05:samba服务器配置
- IAP 破解漏洞验证
- IOS 网络浅析-(八 NSURLSession简介)
- Java学习-029-JSON 之三 -- 模仿 cssSelector 封装读取 JSON 数据方法
- ie6 css sprites重复加载
- winform降低功耗总结
- hdu4010 Query On The Trees
- DOS的BAT技巧两则
- [译]ASP.NET Core 2.0 路由引擎之网址生成
- Android Studio 错误: 非法字符: '\ufeff'
- 【转】/bin/bash^M: bad interpreter: No such file or directory
- P2146 [NOI2015]软件包管理器
- c/c++ 用前序和中序,或者中序和后序,创建二叉树
- JVM笔记(二)JVM基本结构
- 3-2 axios基础介绍
- vue--点击事件