关于在bootstrap的tab栏中渲染echats图表,切换tab时echats不显示问题
2024-08-30 01:47:25
在开发过程中遇到这样个问题:
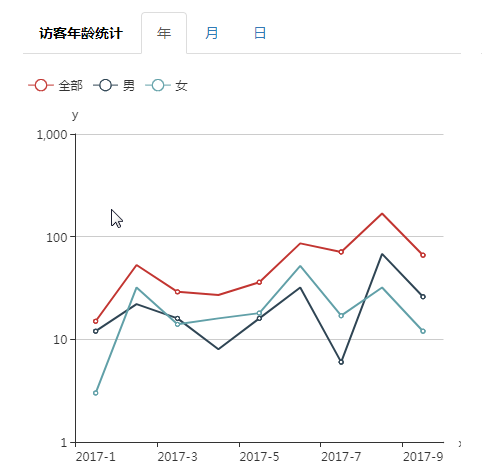
利用bootstrap中的tab栏,每当点击tab栏的导航时,echats仅仅只渲染第一个tab的内容,切换tab时,echats图表不显示。


其html代码为:
 <div class="col-xs-6" style="padding:10px;">

   <ul class="nav nav-tabs" id="myTab1">

      <li><a href="##" style="font-weight: 700;color:black;">访客年龄统计</a></li>

      <li class="active"><a href="#home11" data-id="0">年</a></li>

      <li><a href="#home12" data-id="1">月</a></li>

      <li><a href="#home13" data-id="2">日</a></li>

   </ul>

   <div class="tab-content">

      <div class="tab-pane active" id="home11">

         <!-- echarts容器 -->

        <div class="chart">

           <div id="main_11" style="height:400px;"></div>

        </div>

      </div>

      <div class="tab-pane" id="home12">

        <div class="chart">

           <div id="main_12" style="height:400px;"></div>

        </div>

      </div>

      <div class="tab-pane" id="home13">

        <div class="chart">

           <div id="main_13" style="height:400px;"></div>

        </div>

      </div>

    </div>

 </div>
js代码为:
 var myChart11 = echarts.init(document.getElementById('main_11'));

 var myChart12 = echarts.init(document.getElementById('main_12'));

 var myChart13 = echarts.init(document.getElementById('main_13'));

 // 指定图表的配置项和数据

 option = {

   title: {

     text: '',

     left: 'center'

   },

   tooltip: {

     trigger: 'item',

     formatter: '{a} <br/>{b} : {c}'

   },

   legend: {

     left: 'left',

     data: ['全部', '男', '女']

   },

   xAxis: {

     type: 'category',

     name: 'x',

     splitLine: { show: false },

     data: ['2017-1', '2017-2', '2017-3', '2017-4', '2017-5', '2017-6', '2017-7', '2017-8', '2017-9']

   },

   grid: {

     left: '3%',

     right: '4%',

     bottom: '3%',

     containLabel: true

   },

   yAxis: {

     type: 'log',

     name: 'y'

   },

   series: [

     {

       name: '全部',

       type: 'line',

       data: [15, 53, 29, 27, 36, 86, 71, 168, 66]

     },

     {

       name: '男',

       type: 'line',

       data: [12, 22, 16, 8, 16, 32, 6, 68, 26]

     },

     {

       name: '女',

       type: 'line',

       data: [3, 32, 14, 16, 18, 52, 17, 32, 12]

     }

   ]

 };

 // 使用刚指定的配置项和数据显示图表。

 myChart11.setOption(option);
 myChart12.setOption(option);
 myChart13.setOption(option);
此代码的结果为上边图片所展示的效果,经过查找之后发现“月”和“日”所对应的echats图表的宽度为0,根本就没有画在所对应的盒子中,也就是说根本就没有渲染。
后来经过查资料发现了一个方法可以解决这个问题,那便是给tab栏中的导航栏注册“shown.bs.tab”事件,在事件里边让每个echats渲染一遍。
  var arr=[];

  var myChart11 = echarts.init(document.getElementById('main_11'));

  var myChart12 = echarts.init(document.getElementById('main_12'));

  var myChart13 = echarts.init(document.getElementById('main_13'));

  // 指定图表的配置项和数据

  option = {

    title: {

      text: '',

      left: 'center'

     },

    tooltip: {

      trigger: 'item',

      formatter: '{a} <br/>{b} : {c}'

    },

    legend: {

      left: 'left',

      data: ['全部', '男', '女']

    },

    xAxis: {

      type: 'category',

      name: 'x',

      splitLine: { show: false },

      data: ['2017-1', '2017-2', '2017-3', '2017-4', '2017-5', '2017-6', '2017-7', '2017-8', '2017-9']

    },

    grid: {

      left: '3%',

      right: '4%',

      bottom: '3%',

      containLabel: true

    },

    yAxis: {

      type: 'log',

      name: 'y'

    },

    series: [

      {

        name: '全部',

        type: 'line',

        data: [15, 53, 29, 27, 36, 86, 71, 168, 66]

      },

      {

        name: '男',

        type: 'line',

        data: [12, 22, 16, 8, 16, 32, 6, 68, 26]

      },

      {

        name: '女',

        type: 'line',

        data: [3, 32, 14, 16, 18, 52, 17, 32, 12]

      }

    ]

  };

  // 使用刚指定的配置项和数据显示图表。

  myChart11.setOption(option);

  arr.push(myChart11);

  myChart12.setOption(option);

  arr.push(myChart12);

  myChart13.setOption(option);

  arr.push(myChart13);

  // 给tab导航按钮注册事件,让其渲染

  $('#myTab1 li a').on('shown.bs.tab', function (e) {

    for (var i = 0; i < arr.length; i++) {

      arr[i].resize();

    }

  });

  // 当浏览器窗口大小出现变化时,重新渲染

  $(window).resize(function () {

     for (var i = 0; i < arr.length; i++) {

       arr[i].resize();

    }

  });
仅仅只是添加了一个数组,将要渲染的盒子方法添加到数组里边,当事件被触发的时候,通过遍历这个数组,将这些方法再调用一次,这样就可以解决以上问题。
最新文章
- Android 启动多个闹钟。
- hdu 敌兵布阵(线段树之单点更新)
- javaio-printwriter
- BC之The mook jong
- appium的xpath定位
- ABAP自定义类的构造方法
- Http和Socket连接区别
- centos系统python升级2.7.3
- JavaScript 判断是否为undefined
- 使用spring-amqp结合使用rabbitmq
- notepad++搜索结果不显示line XX的方法
- Spring之单元测试
- 使用npm安装配置vue
- jsp笔记----97DatePicker日期插件简单使用
- BBS-文章详情页、点赞功能
- C/C++中#pragma once的使用
- filebeat-1-连通logstash
- Spring之配置文件中引入其它配置文件
- Serv-U 的升级及数据备份和迁移【转】
- 使用Bootstrap 3开发响应式网站实践02,轮播