Top 10 Java Debugging Tips with Eclipse
In this tutorial we will see about debugging java applications using Eclipse. Debugging helps us to identify and fix defects in the application. We will focus on run-time issues and not compile time errors. There are command line debuggers like gdb available. In this tutorial we will focus on GUI based debugger and we take our favourite IDE Eclipse to run through the tutorial. Though we say Eclipse, the points are mostly generic and is suitable for debugging using most of the IDEs like NetBeans too.
Before going through this tutorial, I recommend you to have a look at Eclipse shortcuts and it will really help. My Eclipse version is Juno as of writing this tutorial.
- Do not use System.out.println as a tool to debug.
- Enable detailed log level of all the components involved.
- Use a log analyzer to read logs.
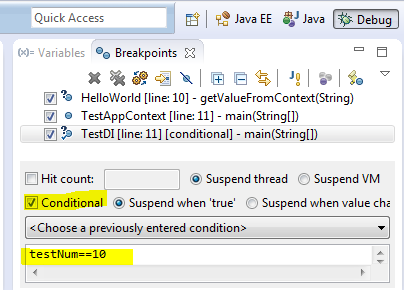
1. Conditional Breakpoint
Hope we know how to add a breakpoint. If not, just click on the left pane (just before the line number) and a breakpoint will be created. In debug perspective, ‘Breakpoints’ view will list the breakpoint created. We can add a boolean condition to it. That is, the breakpoint will be activated and execution will hold only if the boolean condition is met otherwise this breakpoint will be skipped.
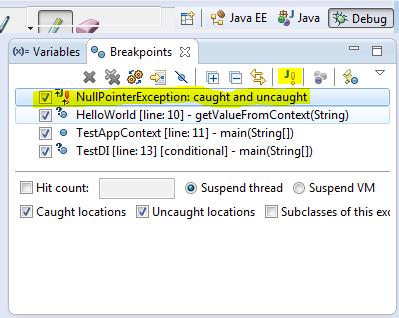
2. Exception Breakpoint
In Breakpoints view there is a button labeled as J! We can use that button to add a java exception based breakpoint. For example we want the program to halt and allow to debug when a NullPointerException is thrown we can add a breakpoint using this.
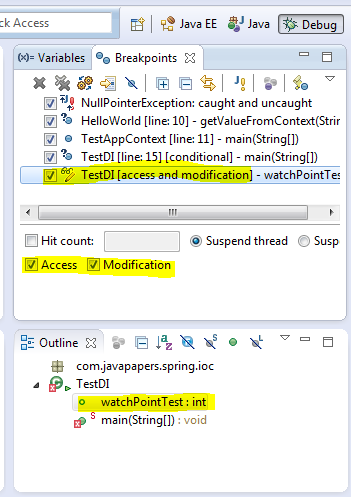
3. Watch Point
This is one nice feature I love. When a chosen attribute is accessed or modified program execution will halt and allow to debug. Select a class variable in Outline view and from its context menu select Toggle Watchpoint. This will create a watch point for that attribute and it will be listed in Breakpoints view.
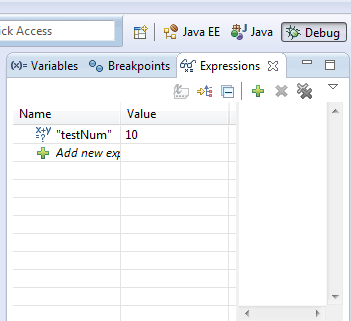
4. Evaluation (Display or Inspect or Watch)
Ctrl+Shift+d or Ctrl+Shift+i on a selected variable or expression
will show the value. We can also add a permanent watch on an
expression/variable which will be shown in Expressions view when debug
is on.
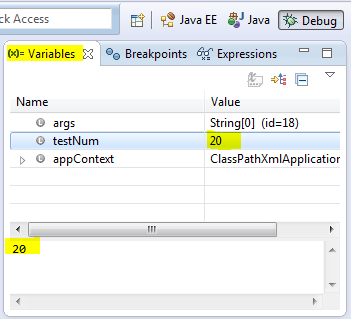
5. Change Variable Values
We can change the value of a variable on the fly during debug. Choose
a variable and go to Variables view and select the value, type and
enter.
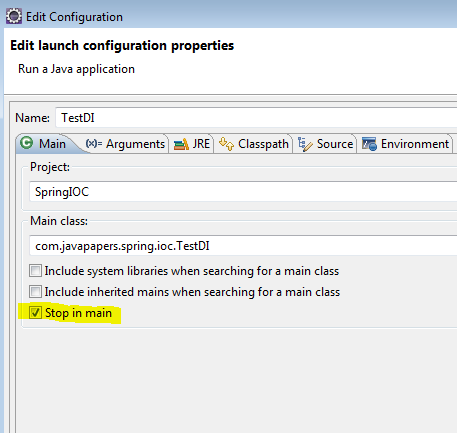
6. Stop in Main
In Run/Debug Settings, Edit Configuration we can enable a check box
that says Stop in main. If enabled when we debug a java program that
launches with a main method, the execution halts at first line of main
method.
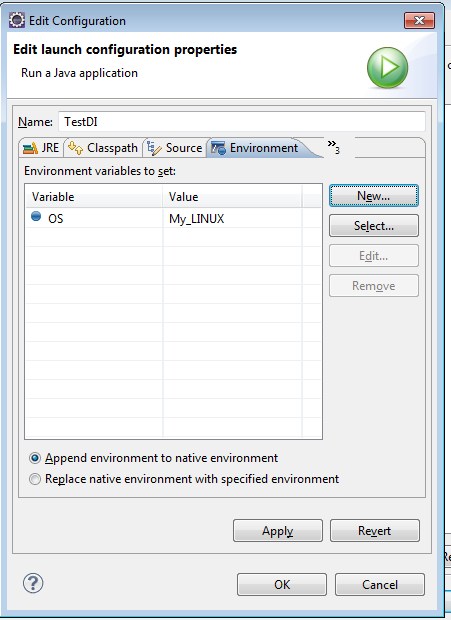
7. Environment Variables
Instead of going to System properties to add an environment variable,
we can conveniently add it through Edit Configuration dialog box.
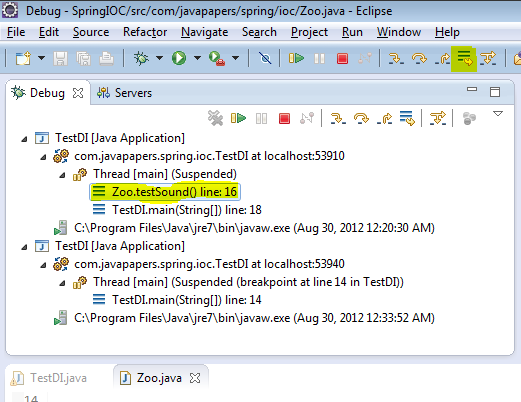
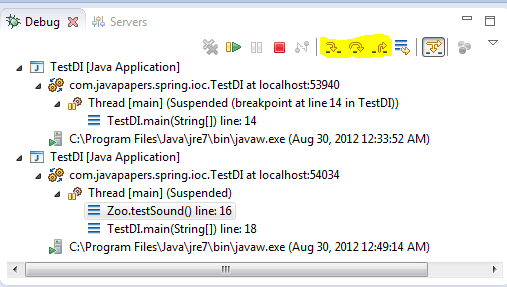
8. Drop to Frame
This is the second best feature I love. We can just return the
control to any frame in the call stack during debug. Changes made to
variables will not be reset. Choose the stack level which you want to go
back and restart debug from there and click the drop to frame button
from debug toolbar. Eclipse is cool!
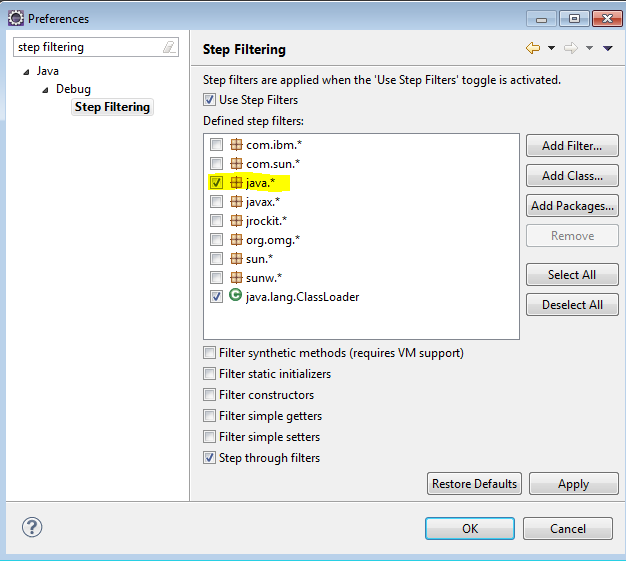
9. Step Filter
When we Step Into (F5) a method we may go into external libraries
(like java) and we may not need it. We can add a filter in preferences
and exclude packages.
10. Step Into, Over and Return
I kept this as the last point as this is the first thing to learn in debugging :-)
- F5 – Step Into: moves to next step and if the current line has a
method call the control will go into the first line of the called
method. - F6 – Step Over: moves the control to next line. If there is a method
call in the current line, it executes the method call internally and
just moves the control to next line. - F7 – Step Return: When done from inside a method the control will
move to the calling line from where the current method is invoked. - F8 – Move to next breakpoint.
This Core Java tutorial was added on 30/08/2012.
最新文章
- LCS最长公共子序列(最优线性时间O(n))
- 简单版问卷调查系统(Asp.Net+SqlServer2008)
- Java快速入门
- mysql 断电 启动不了 start: Job failed to start
- perl binlog dml操作报告
- Arpa's weak amphitheater and Mehrdad's valuable Hoses
- 解析GenericOptionsParser
- php源码分析之php_info输出中css样式是怎么来的
- 我眼中的ASP.NET Core之微服务
- 深入理解ES6之——迭代器与生成器
- 为什么很多第三方接口,都改成了基于http,直接传递json数据的方式来代替webservice?
- JavaScript 深拷贝(deep copy)和浅拷贝(shallow copy)
- Luogu4725 【模板】多项式对数函数(NTT+多项式求逆)
- c++ 判断数组元素是否有负数(any_of)
- L1-003 个位数统计
- Java中创建数组的几种方法
- Android4.2.2启动动画前播放视频
- SpreadSheet数据导出为DataTable z
- Django的url别名功能的使用
- node.js---sails项目开发(3)