matplotlib 并列条形图
2024-09-04 15:31:02
1 绘制并列条形图,并在条形图上加标注
1.1 代码
from matplotlib import pyplot

from matplotlib import font_manager

import numpy as np

import random

# 小学期间语文和数学的成绩

x_label = ['一年级','二年级','三年级','四年级','五年级','六年级']

chinese = [random.randint(40,100) for i in range(6)]

math = [random.randint(20,100) for i in range(6)]

#x轴刻度 用数组方便数据运算

x = np.arange(len(x_label))

width = 0.3 # 条形图宽度

plt.figure(figsize=(20,8),dpi=80)

# 语文条形图

# bar(self, x, height, width=0.8, bottom=None, *, align='center', data=None, **kwargs)

# 将chinese的条形图向左平移半个宽度

rects1=plt.bar(x-width/2,chinese,width=width,label='语文')

# 将math的条形图向左平移半个宽度

rects2=plt.bar(x+width/2,math,width=width,label='数学')

# 添加标题、图例、网格、y轴标题、x刻度标签

my_font = font_manager.FontProperties(fname='C:/Windows/Fonts/msyh.ttc',size=10)

plt.title('小学语文和数学分数对比',fontproperties=my_font)

plt.legend(prop=my_font,loc='upper right')

plt.grid(alpha=0.4)

plt.ylabel('分数',fontproperties=my_font)

plt.xticks(x,x_label,fontproperties=my_font)

# 在条形图上加标注(水平居中)

# plt.bar()可以返回条形图的每个条形,所以前代码将各个柱形赋值给一个变量

for rect1 in rects1:

    height = rect1.get_height()

    plt.text(rect1.get_x()+rect1.get_width()/2,height+1,str(height),ha='center')

for rect2 in rects2:

    height = rect2.get_height()

    plt.text(rect2.get_x()+rect2.get_width()/2,height+1,str(height),ha='center')

plt.show()
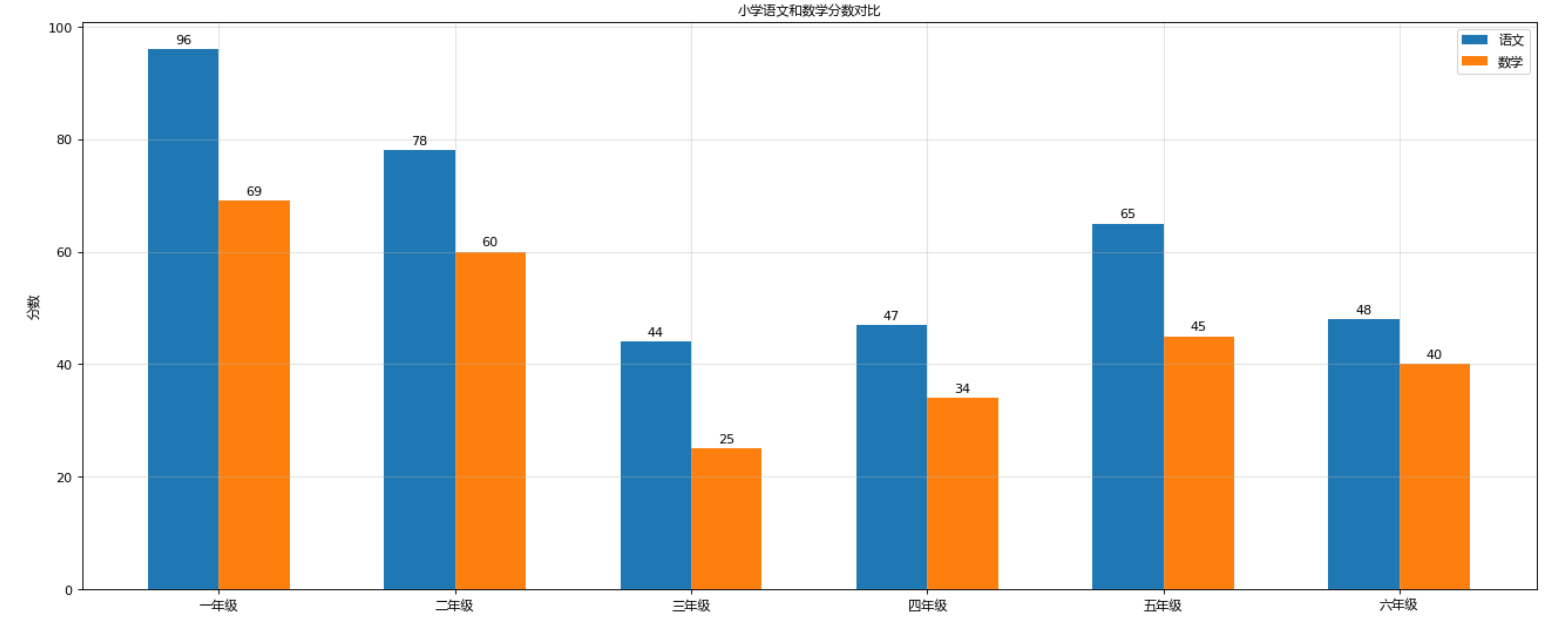
1.2 图表展示
2 代码分解
2.1 并列条形图
在同一个绘图区内绘制两个条形图,此时两个条形图重叠在一起
为了解决重叠,调整两个条形图的x。如上图chinese条形图向左平移半个宽度,math条形图向右平移半个宽度,不用移动x轴
# 语文条形图

# bar(self, x, height, width=0.8, bottom=None, *, align='center', data=None, **kwargs)

# 将chinese的条形图向左平移半个宽度

rects1=plt.bar(x-width/2,chinese,width=width,label='语文')

# 将math的条形图向右平移半个宽度

rects2=plt.bar(x+width/2,math,width=width,label='数学')
2.2 中文显示
2.2.1 使用font_manager导入电脑中的字体
查看电脑支持的字体
查看Linux、Mac下支持的字体:
终端执行
fc-list
查看支持的中文:
# 冒号前有两个空格

fc-list  :lang=zh
查看win下的字体:
'C:/windows/Fonts/'
#### 在代码中引入中文

```python

my_font = font_manager.FontProperties(fname='C:/Windows/Fonts/msyh.ttc',size=10)

plt.title('小学语文和数学分数对比',fontproperties=my_font)
注意
plt.title、plt.ylabel、plt.xticks等需要使用中文时,参数为fontproperties=my_font
但设置图例的时候使用中文,plt.legend中,参数为prop=my_font
2.2.2 使用rcParams引入中文
plt.rcParams['font.family'] = ['sans-serif']

plt.rcParams['font.sans-serif'] = ['SimHei']
2.3 在条形图上加标注
plt.bar()可以返回条形图的每个条形,所以前代码将各个柱形赋值给一个变量
rects1=plt.bar(x-width/2,chinese,width=width,label='语文')
再使用for遍历每一个条形
获取到一个条形后,使用get_height()方法获取条形的高,即值
再使用plt.text加标注,text(self, x, y, s, fontdict=None, **kwargs)
注:
- get_x()获取的是条形的左侧,若要标注居中,需要在get_x()的基础上再向右移动半个宽度;
- 若标注的高仅使用get_height(),则会出现标注和条形的间隔过小,此时get_height()+1将标注往上,增加标注和条形之间的距离;
- 标注内容要求为str类型,需要将值进行转换
- 调整标注和定位点的对齐方式使用参数ha={'center','right','left'}
for rect1 in rects1:

    height = rect1.get_height()

    plt.text(rect1.get_x()+rect1.get_width()/2,height+1,str(height),ha='center')
最新文章
- 网络原因导致 npm 软件包 node-sass / gulp-sass 安装失败的处理办法
- ThinkPHP 多语言
- Java Netty 4.x 用户指南
- 在macOS Sierra 10.12搭建PHP开发环境
- JavaScript获取元素CSS属性
- SQL 存储过程中in
- Jboss image upload and http access to show image--reference
- struct tm->time() localtime() gmtime()
- shell 脚本FTP自动上传文件
- js简单实现链式调用
- 企业建站http://www.douco.com/
- 关于《Unity3D/2D游戏开发从0到1》书籍再版说明
- 网站开发进阶(二十六)js刷新页面方法大全
- Json解析数据导致顺序改变问题
- Wireshark简单使用教程1——附视频
- 爬虫学习--MOOC爬取豆瓣top250
- php对二维数据排序
- udp套接字及利用socketserver模块实现并发以及并发编程
- 38.html----相对于父元素的fixed定位的实现
- Eclipse中使用MySql遇到:Loading class `com.mysql.jdbc.Driver'. This is deprecated. The new driver class is `com.mysql.cj.jdbc.Driver'. The driver is automatically registered via the SPI and manual loading o