解释变量(Explanatory Variable)
转自:http://www.statisticshowto.com/explanatory-variable/
What is an Explanatory Variable?
An explanatory variable is a type of independent variable. The two terms are often used interchangeably. But there is a subtle difference between the two. When a variableis independent, it is not affected at all by any other variables. When a variable isn’t independent for certain, it’s an explanatory variable.
Let’s say you had two variables to explain weight gain: fast food and soda. Although you might think that eating fast food intake and drinking soda are independent of each other, they aren’t really. That’s because fast food places encourage you to buy a soda with your meal. And if you stop somewhere to buy a soda, there’s often a lot of fast food options like nachos or hot dogs. Although these variables aren’t completely independent of each other, they do have an effect on weight gain. They are called explanatory variables because they may offer some explanation for the weight gain.
The line between independent variables and explanatory variables is usually so unimportant that no one ever bothers. That’s unless you’re doing some advanced research involving lots of variables that can interactwith each other. It can be very important in clinical research. For most cases, especially in statistics, the two terms are basically the same.
Explanatory Variables vs. Response Variables
The response variable is the focus of a question in a study or experiment. An explanatory variable is one that explains changes in that variable. It can be anything that might affect the response variable. Let’s say you’re trying to figure out if chemo or anti-estrogen treatment is better procedure for breast cancer patients. The question is: which procedure prolongs life more? And so survival time is the response variable. The type of therapy given is the explanatory variable; it may or may not affect the response variable. In this example, we have only one explanatory variable: type of treatment. In real life you would have several more explanatory variables, including: age, health, weight and other lifestyle factors.
A scatterplotcan help you see trends between paired data. If you have both a response variable and an explanatory variable, the explanatory variable is always plotted on the x-axis (the horizontal axis). The response variable is always plotted on the y-axis (the vertical axis).
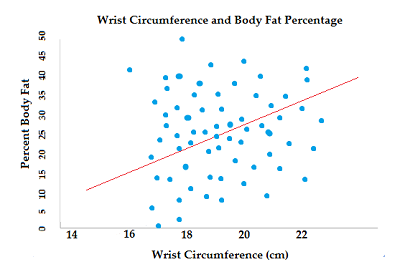
If you look at the above image, you should be able to tell that wrist size isn’t a very good explanatory variable to predict body fat (the response variable). The red line in the image is the “line of best fit.” Although it runs through the middle of the spread of dots, most of the dots aren’t anywhere near it. This means that the explanatory variable really isn’t explaining anything.
On the other hand, how large a person’s thighs are is a better predictor of body fat. Even this isn’t perfect. Many very fit people have large thighs! See how closer the dots are to the red line of best fit.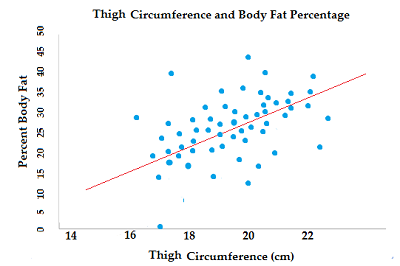
Check out our Youtube channel for hundreds of statistics help videos!
Reference: J Wilson at UGA COE.
If you prefer an online interactive environment to learn R and statistics, this free R Tutorial by Datacamp is a great way to get started. If you’re are somewhat comfortable with R and are interested in going deeper into Statistics, try this Statistics with R track.
最新文章
- JavaEE中Web服务器、Web容器、Application服务器区别及联系
- 从头安装及配置PL/SQL Developer
- Circular Queue Implementation Principle
- JVM-类加载机制
- 科谱,如何单机环境下合理的备份mssql2008数据库
- webpack我遇到的一些坑
- css应对已有class和特殊class的冲突
- MSSQL手札三 MSSQL存储过程
- ios 数字禁止变成电话号码
- Docker系列(一)安装
- 纯JS URL编解码
- cron expr
- PHP版本替换, phpinfo和php -v显示版本信息不一致
- 【Android Studio安装部署系列】三十一、从Android studio3.0.0升级到Android studio3.0.1
- express和cors跨域
- HDU 5984.Pocky(2016 CCPC 青岛 C)
- xcodebuild构建时报错unknown error -1=ffffffffffffffff Command /bin/sh failed with exit code 1
- elasticsearch简单操作(一)
- latex 导入pdf
- Ubuntu16.04常用软件源
热门文章
- Codeforces 437D The Child and Zoo - 树分治 - 贪心 - 并查集 - 最大生成树
- 树之105 Construct Binary Tree from Preorder and Inorder Traversal
- 尚硅谷面试第一季-15Mysql什么时候建索引
- 0-1背包dp|波动数列|2014年蓝桥杯A组10-fishers
- Convert DataFrame string complex i to j python // “Cloning” row or column vectors
- 【做题】CF119D. String Transformation——KMP
- pip运行错误
- Torch 两个矩形框重叠面积的计算 (IoU between tow bounding box)
- ES6中对象
- Python打印矩形、直角三角形、等腰三角形、菱形