linux kernel driver debug
1. print
printk(): never
pr_debug(): always good
dev_dbg(): prefered when you have a struct device object
netdev_dbg(): prefered when you have a struct netdevice object
[something]_dbg(): prefered when you have a that something object
see the implementation in source code:
/* If you are writing a driver, please use dev_dbg instead */

#if defined(CONFIG_DYNAMIC_DEBUG)

/* dynamic_pr_debug() uses pr_fmt() internally so we don't need it here */

#define pr_debug(fmt, ...) \

dynamic_pr_debug(fmt, ##__VA_ARGS__)

#elif defined(DEBUG)

#define pr_debug(fmt, ...) \

printk(KERN_DEBUG pr_fmt(fmt), ##__VA_ARGS__)

#else

#define pr_debug(fmt, ...) \

no_printk(KERN_DEBUG pr_fmt(fmt), ##__VA_ARGS__)

#endif
It shows the CONFIG_DYNAMIC_DEBUG/DEBUG option can be used to enable or disable the print.
dynamic debug:
Benefits:
Almost no overhead when log code is not enabled.
Turn on/off debug log at runtime.
No need to recompile the kernel.
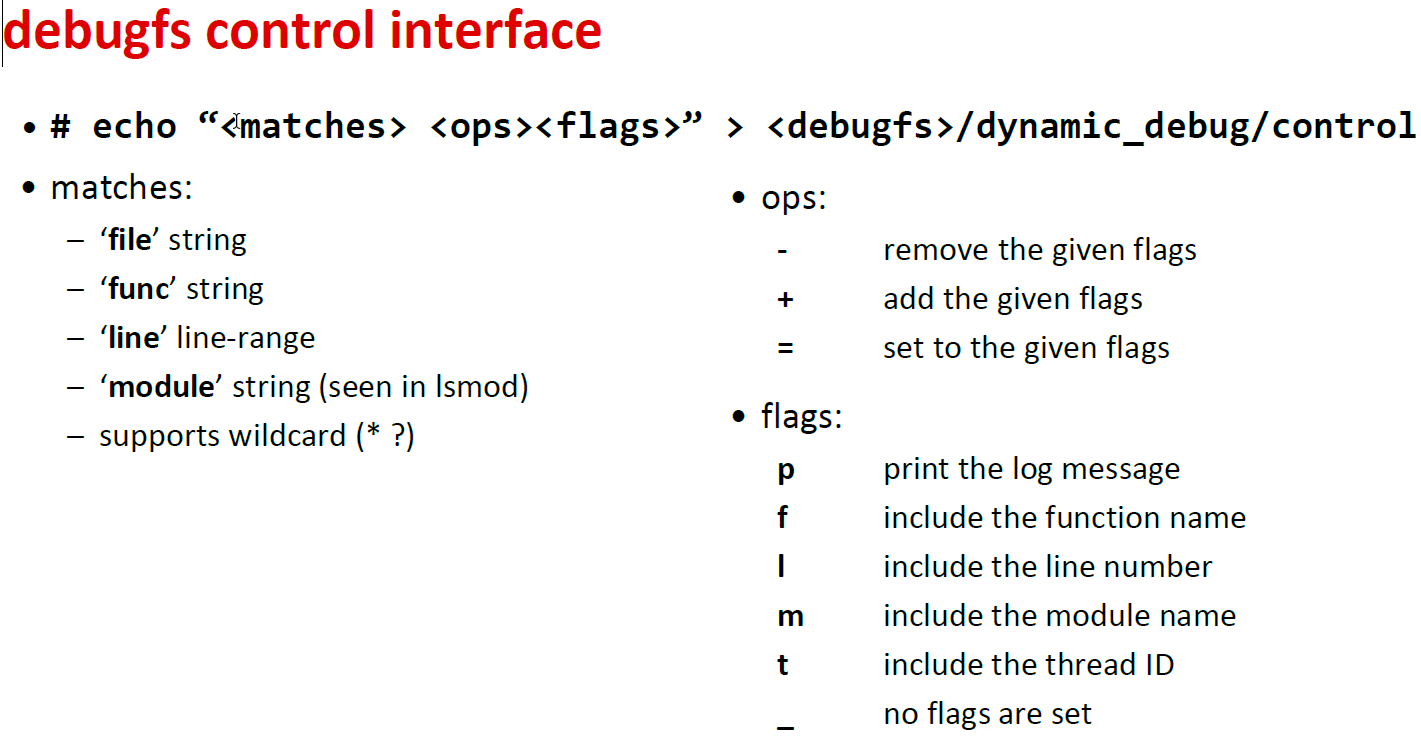
Control interface: uboot boot argus, debugfs
# mount -t debugfs none /sys/kernel/debug/
# cd /sys/kernel/debug/dynamic_debug/
# echo “file xxx.c +p” > control
# echo “file svcsock.c line 1603 +p” > control
# echo “file drivers/usb/core/* +p” > control
# echo “file xxx.c -p” > control
retrive the log information
dmesg
dmesg -C clear
dmesg -c show and then clear.
tail /var/log/syslog-f dynamic to show the log information in case the syslogd is running.
The debug log default size is 64K, you can configure it by menuconfig, note that the size is calculted by 2^n.
dmesg -n 5
Set console logging filter to KERN_WARNING or more severe.
dmesg -l warn
Only print the logs of KERN_WARNING in the kernel ring buffer.
Another option is dynamic debug by configuring the debugfs
enable it in kernel : CONFIG_DYNAMIC_DEBUG=y menuconfig
using pr_debug(), dev_dbg() ... in driver source code
e.g.
2. using file system proc/ memory large file or sequence file
3. using ioctrl to get/set specific data
Below shall enable the kernel debug. CONFIG_DEBUG_INFO =y
4. gdb list command to idenfiy the line of oops
e.g.
5. addr2line command to identify the line of oops
e.g. addr2line -fe vmlinux ce000678
6. objdump -dS .o
-d: display assembler conetents of executable sections
-S intermix source code with disassembly
最新文章
- Git和Github简单教程
- Ubuntu 14.04 安装pdf阅读器
- User mode and kernel mode
- HTML5 结构性标签 行内语义性标签
- Swift-打开其它Storyboard中的自定义模态窗口
- Qt label加边框
- cpu和内存的关系
- python入门 2014-3-21
- Lotus防病毒与数据备份案例
- OpenGL9-(FreeImage)加载图片-作为纹理
- POJ1125 Stockbroker Grapevine(最短路)
- mongodb的地理空间索引常见的问题
- linux kernel中timer的使用
- QT学习 之 事件与事件过滤器(分为五个层次)
- ORM-Dapper学习<二>
- css-display
- oracle 12c 安装指南(各种问题总结)
- [Luogu P1119]灾后重建
- C语言中使用bool
- 后台List里的数据传到前台表格和下拉列表为什么不显示