一行代码让matplotlib图表变高大上
1 简介
matplotlib作为Python生态中最流行的数据可视化框架,虽然功能非常强大,但默认样式比较简陋,想要制作具有简洁商务风格的图表往往需要编写众多的代码来调整各种参数。
而今天要为大家介绍的dufte,就是用来通过简短的代码,对默认的matplotlib图表样式进行自动改造的Python库:

2 利用dufte自动改造matplotlib图表
通过pip install dufte安装完成后,我们就可以将dufte的几个关键API穿插在常规matplotlib图表的绘制过程中,目前主要有以下几种功能:
2.1 主题设置
dufte最重要的功能是其自带的主题风格,而在matplotlib中有两种设置主题的方式,一种是利用plt.style.use(主题)来全局设置,一般不建议这种方式。
另一种方式则是以下列方式来在with的作用范围内局部使用主题:
# 局部主题设置

with plt.style.context(主题):

    # 绘图代码

    ...
我们今天就都使用第二种方式,首先导入演示所需的依赖库,并从本地注册思源宋体:
import dufte

import numpy as np

import matplotlib.pyplot as plt

from matplotlib import font_manager

# 注册本地思源宋体

fontproperties = font_manager.FontProperties(fname='NotoSerifSC-Regular.otf')
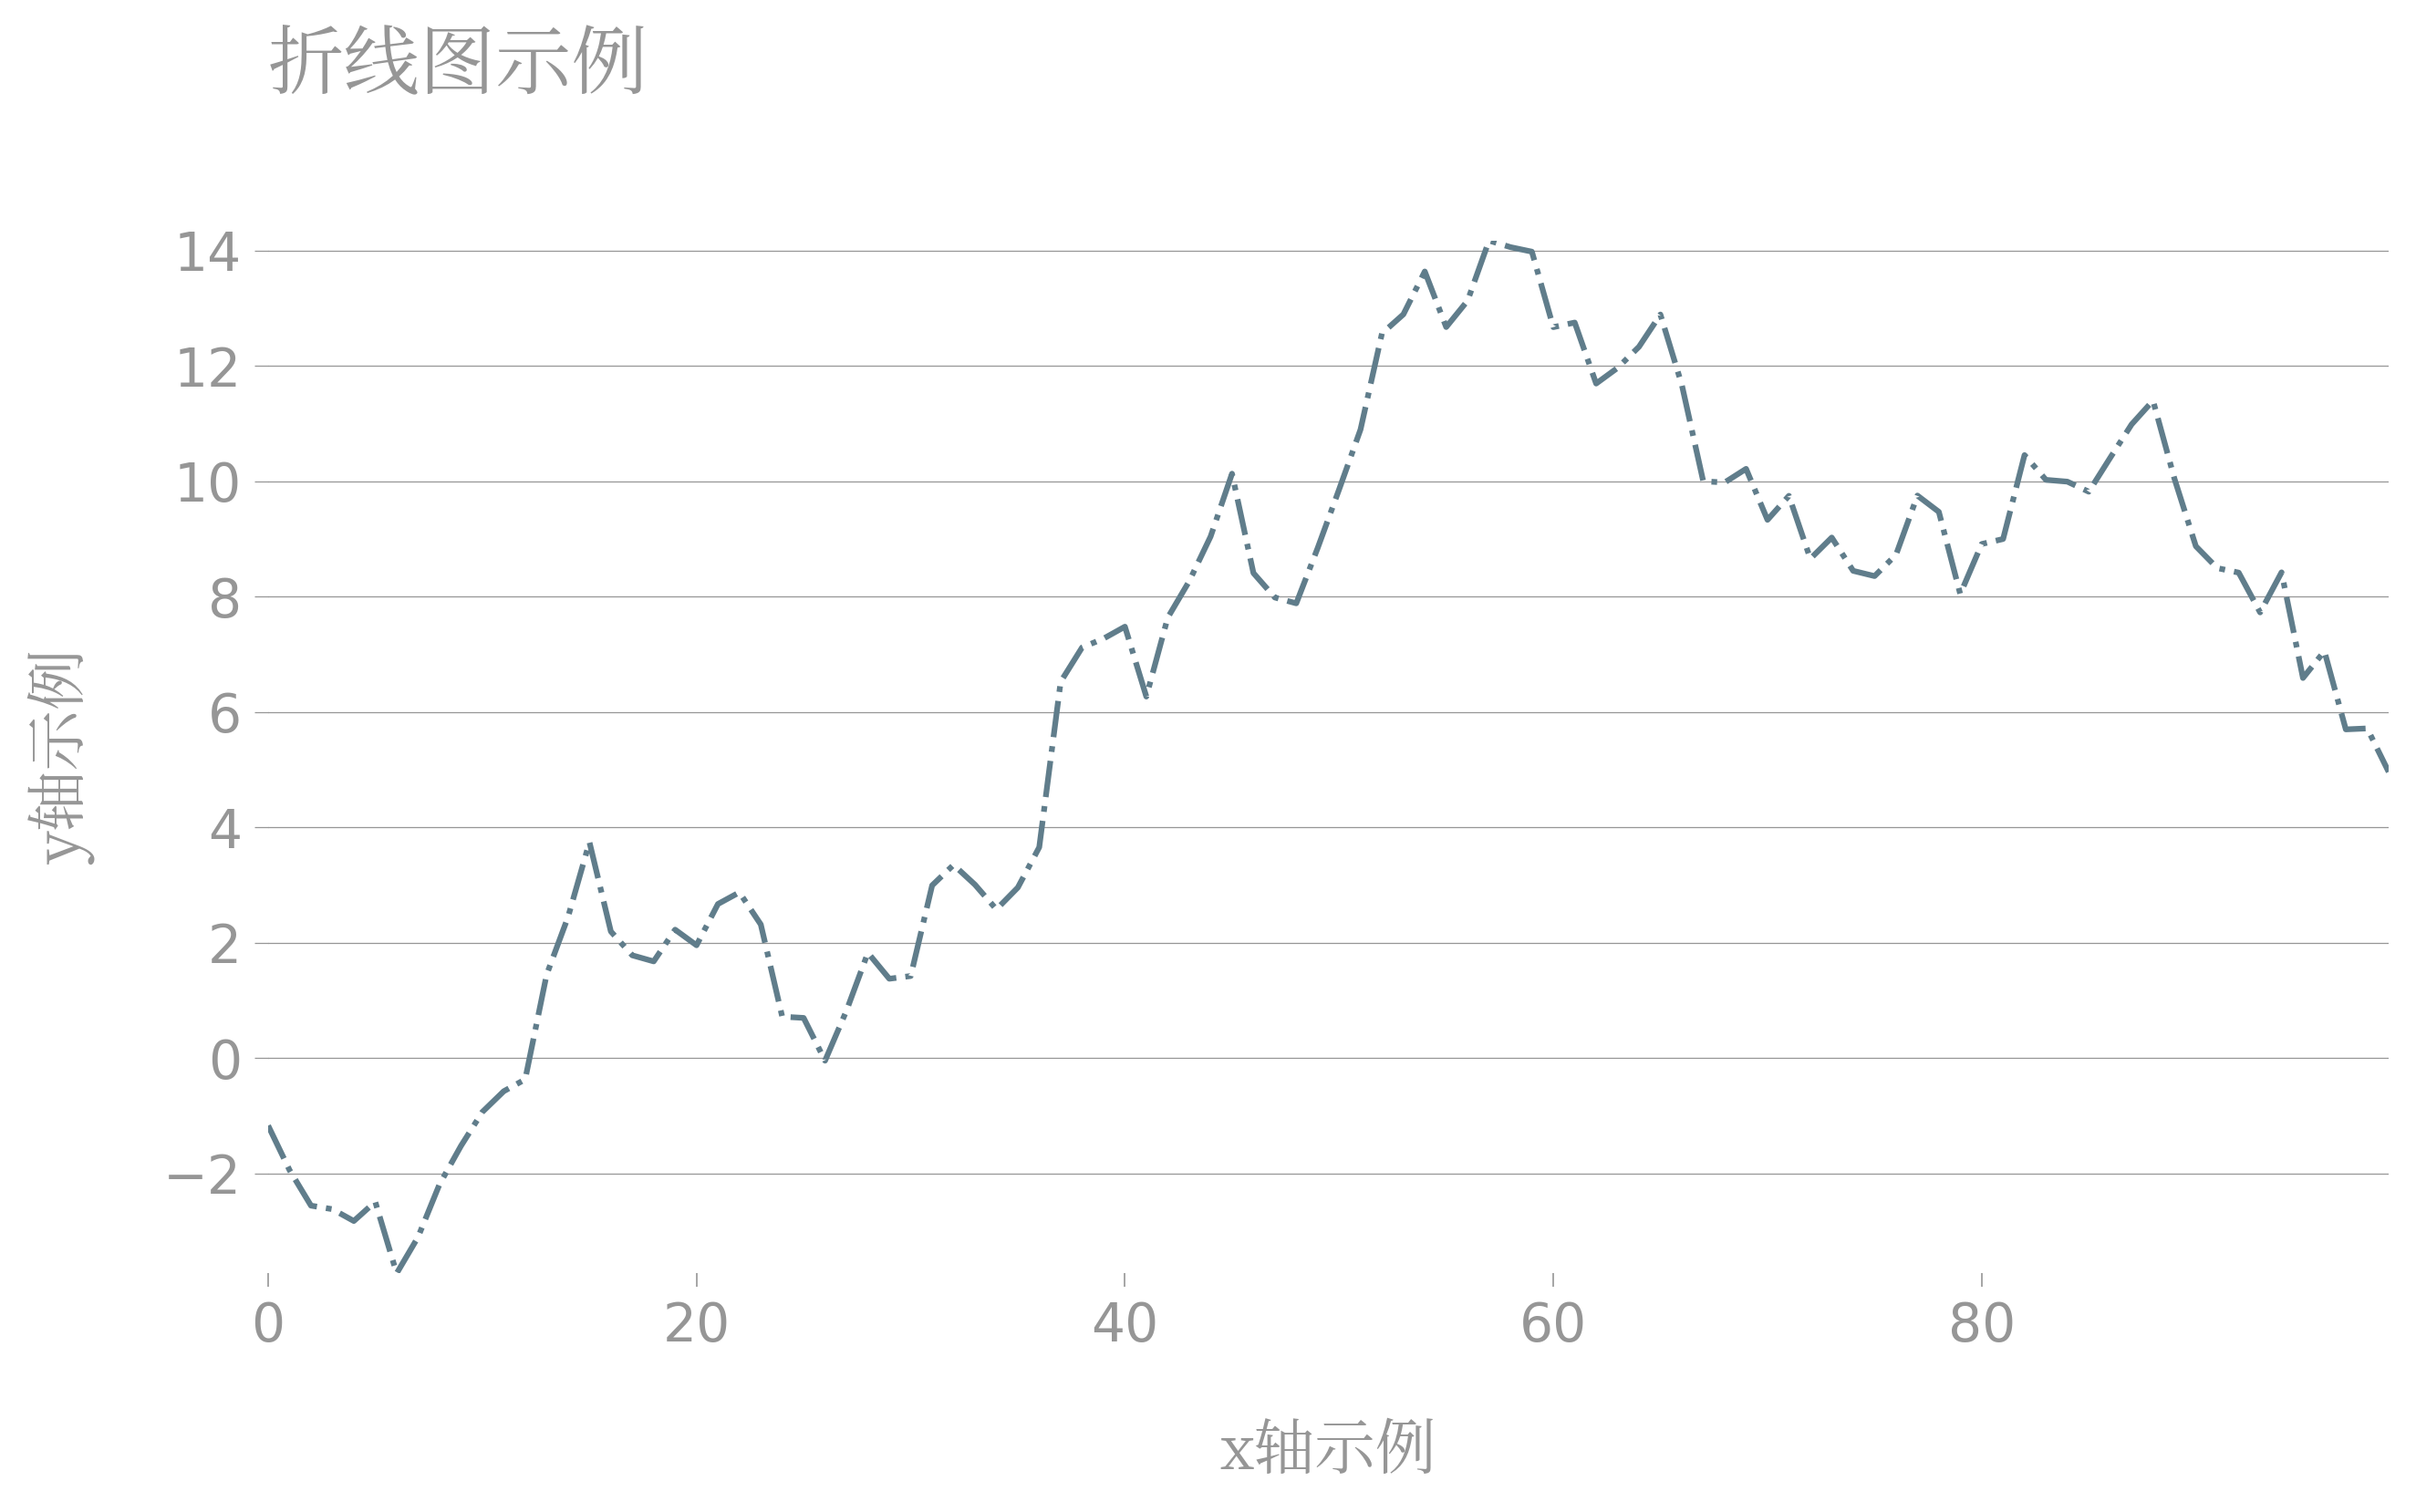
接下来我们以折线图和柱状图为例:
- 折线图
# 折线图示例

with plt.style.context(dufte.style):

    x = range(100)

    y = np.random.standard_normal(100).cumsum()

    fig, ax = plt.subplots(figsize=(10, 5), facecolor='white', edgecolor='white')

    ax.plot(x, y, linestyle='-.', color='#607d8b')

    ax.set_xlabel('x轴示例', fontproperties=fontproperties, fontsize=16)

    ax.set_ylabel('y轴示例', fontproperties=fontproperties, fontsize=16)

    ax.set_title('折线图示例', fontproperties=fontproperties, fontsize=20)

    fig.savefig('图2.png', dpi=300, bbox_inches='tight')
- 柱状图
# 柱状图示例

with plt.style.context(dufte.style):

    x = range(25)

    y = np.random.standard_normal(25)

    fig, ax = plt.subplots(figsize=(10, 5), facecolor='white', edgecolor='white')

    ax.bar(x, y)

    ax.set_xlabel('x轴示例', fontproperties=fontproperties, fontsize=16)

    ax.set_ylabel('y轴示例', fontproperties=fontproperties, fontsize=16)

    ax.set_title('柱状图示例', fontproperties=fontproperties, fontsize=20)

    fig.savefig('图3.png', dpi=300, bbox_inches='tight')
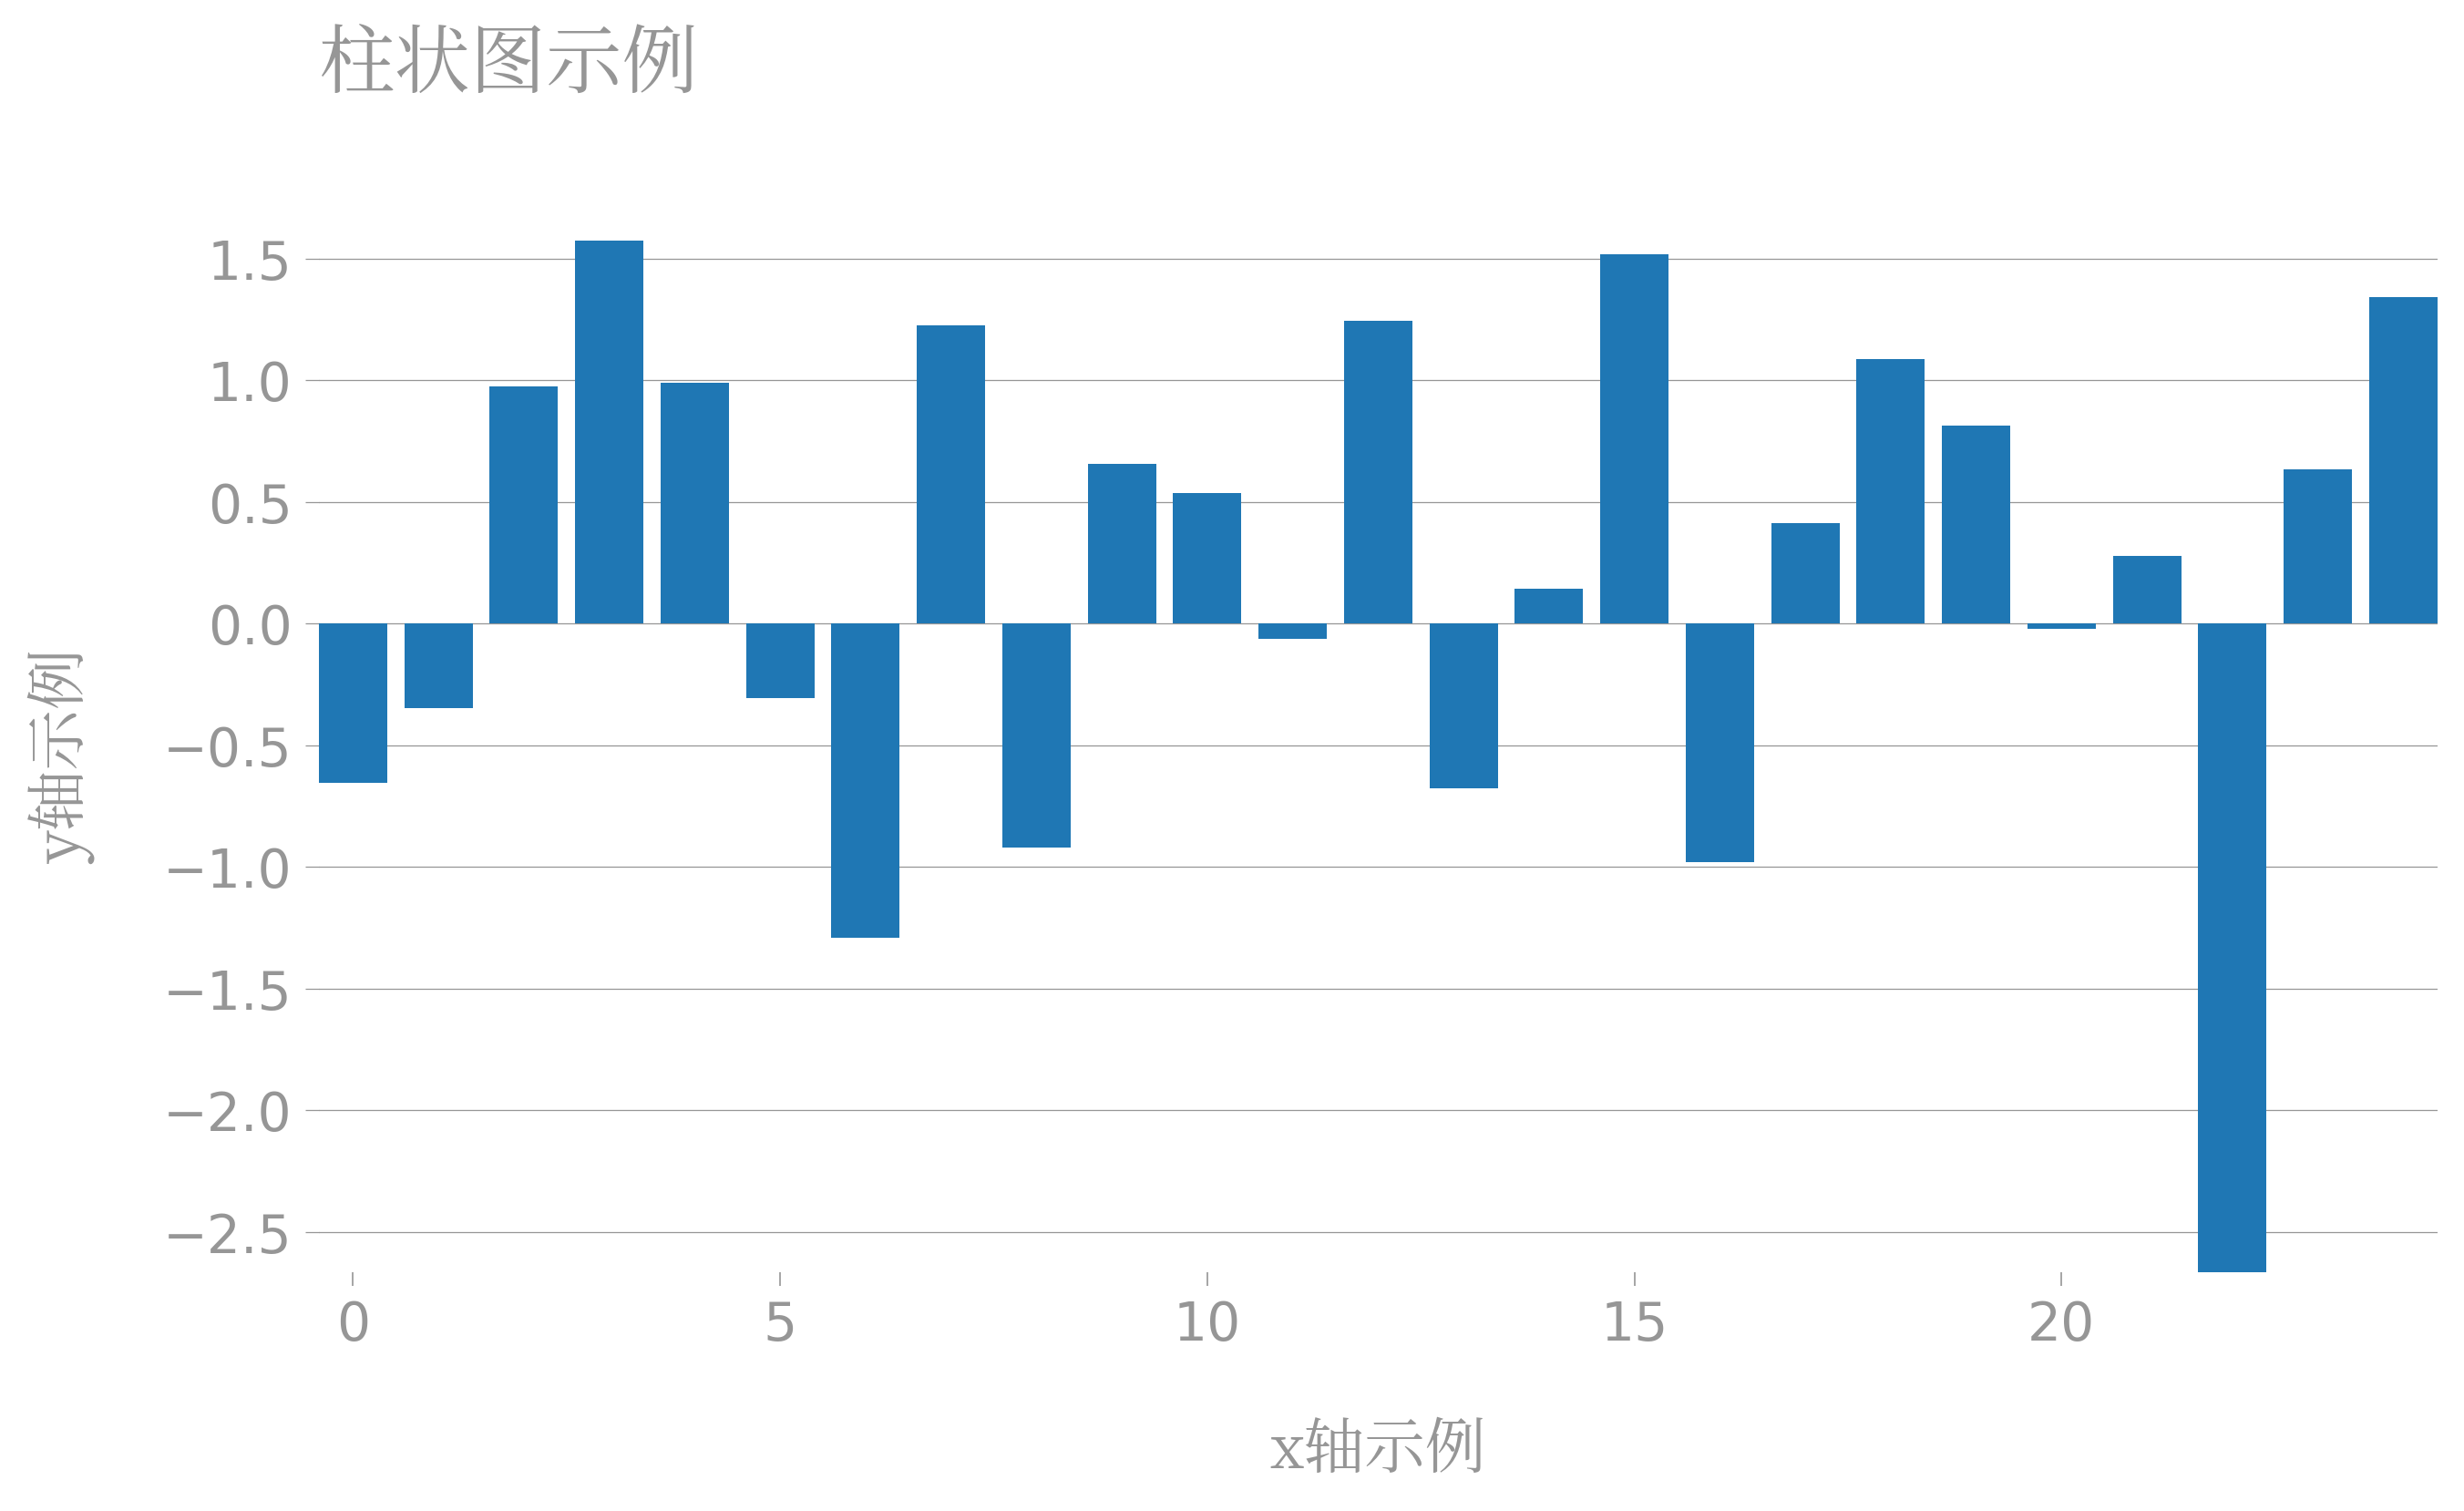
可以看到,dufte自带了一套简洁的绘图风格,主张去除多余的轴线,只保留必要的参考线,适用于我们日常工作中的通用出图需求。
2.2 自动图例美化
除了前面介绍的整体主题风格之外,dufte还自带了一套图例风格化策略,只需要在绘图过程中利用dufte.legend()来代替matplotlib原有的legend()即可,以下面的折线图为例:
# 折线图示例

with plt.style.context(dufte.style):

    x = range(100)

    y1 = np.random.randint(-5, 6, 100).cumsum()

    y2 = np.random.randint(-5, 10, 100).cumsum()

    y3 = np.random.randint(-5, 6, 100).cumsum()

    fig, ax = plt.subplots(figsize=(10, 5), facecolor='white', edgecolor='white')

    ax.plot(x, y1, linestyle='dotted', label='Series 1')

    ax.plot(x, y2, linestyle='dashed', label='Series 2')

    ax.plot(x, y3, linestyle='dashdot', label='Series 3')

    ax.set_xlabel('x轴示例', fontproperties=fontproperties, fontsize=16)

    ax.set_ylabel('y轴示例', fontproperties=fontproperties, fontsize=16)

    dufte.legend()

    ax.set_title('dufte.legend()示例', fontproperties=fontproperties, fontsize=20)

    fig.savefig('图4.png', dpi=300, bbox_inches='tight')
可以看到,对于多系列图表,只需要一行dufte.legend()就可以自动添加出下列别致的图例说明:

2.3 柱状图自动标注
很多时候我们在绘制柱状图时,希望把每个柱体对应的y值标注在柱体上,而通过dufte.show_bar_values(),只要其之前的绘图流程中设置了xticks,它就会帮我们自动往柱体上标注信息:
# 柱状图示例

with plt.style.context(dufte.style):

    x = range(15)

    y = np.random.randint(5, 15, 15)

    fig, ax = plt.subplots(figsize=(10, 5), facecolor='white', edgecolor='white')

    ax.bar(x, y)

    ax.set_xticks(x)

    ax.set_xticklabels([f'项目{i}' for i in x], fontproperties=fontproperties, fontsize=10)

    dufte.show_bar_values()

    ax.set_xlabel('x轴示例', fontproperties=fontproperties, fontsize=16)

    ax.set_ylabel('y轴示例', fontproperties=fontproperties, fontsize=16)

    ax.set_title('柱状图示例', fontproperties=fontproperties, fontsize=20)

    fig.savefig('图5.png', dpi=300, bbox_inches='tight')

作为一个处于开发初期的库,dufte未来势必会加入更多的实用功能,感兴趣的朋友可以对其持续关注。
以上就是本文的全部内容,欢迎在评论区分享你的观点与建议。
最新文章
- php empty,isset,is_null比较(差异与异同)
- Linux VFS Extended Attribute And Access Control Table
- jQueryEasyUi验证
- 在Asp.Net MVC中设定site路径所对应的默认action
- 循环多次ajax请求
- 18数据表&E-R模型&概念数据模型-下(选学)-天轰穿大话数据库视频教程
- html5[1]:优化Android Webview性能
- Java多线程 - 线程状态
- 官网下载jdk
- asp.net mvc常用的数据注解和验证以及entity framework数据映射
- C# Excel操作类
- 设计模式C++实现(1)——工厂模式
- serialVersionUID作用
- C# 语言规范_版本5.0 (第12章 数组)
- 26. leetcode 350. Intersection of Two Arrays II
- Python Web-第二周-正则表达式(Using Python to Access Web Data)
- JavaWeb开发环境搭建Eclipse配置Tomcat
- springboot2 webflux 响应式编程学习路径
- MySQL存储引擎简单介绍
- 【easy】107. Binary Tree Level Order Traversal II 按层输出二叉树