PHPStorm+XDEBUG 调试Laravel
2024-09-20 08:07:23
首先输出phpinfo();
https://xdebug.org/wizard.php 打开然后查看适合你的调试扩展版本 ,目前支持到php7.2
整个页面ctrl+a 复制进去

然后下载 扩展文件 下载到 ext目录下

在你的php.ini末尾加上,扩展文件的路径要注意 然后重启apache
[Debug]

zend_extension = C:\Code\XAMPP\php\ext\php_xdebug-2.6.-7.2-vc15.dll

xdebug.remote_enable = On

xdebug.profiler_enable = On

xdebug.profiler_enable_trigger = On

xdebug.profiler_output_name = cachegrind.out.%t.%p

xdebug.profiler_output_dir ="C:/wamp64/tmp"

xdebug.show_local_vars=

xdebug.var_display_max_children=

xdebug.var_display_max_data=

xdebug.var_display_max_depth=

xdebug.idekey=PhpStorm

xdebug.remote_enable = On

xdebug.remote_host=127.0.0.1

xdebug.remote_port=

xdebug.remote_handler=dbgp
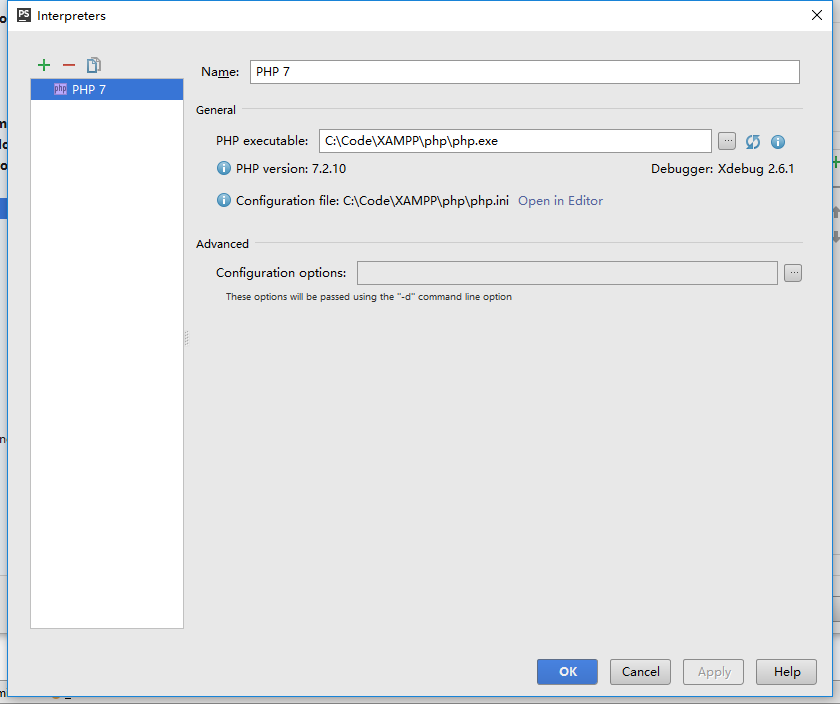
打开phpstrom
配置你的php环境

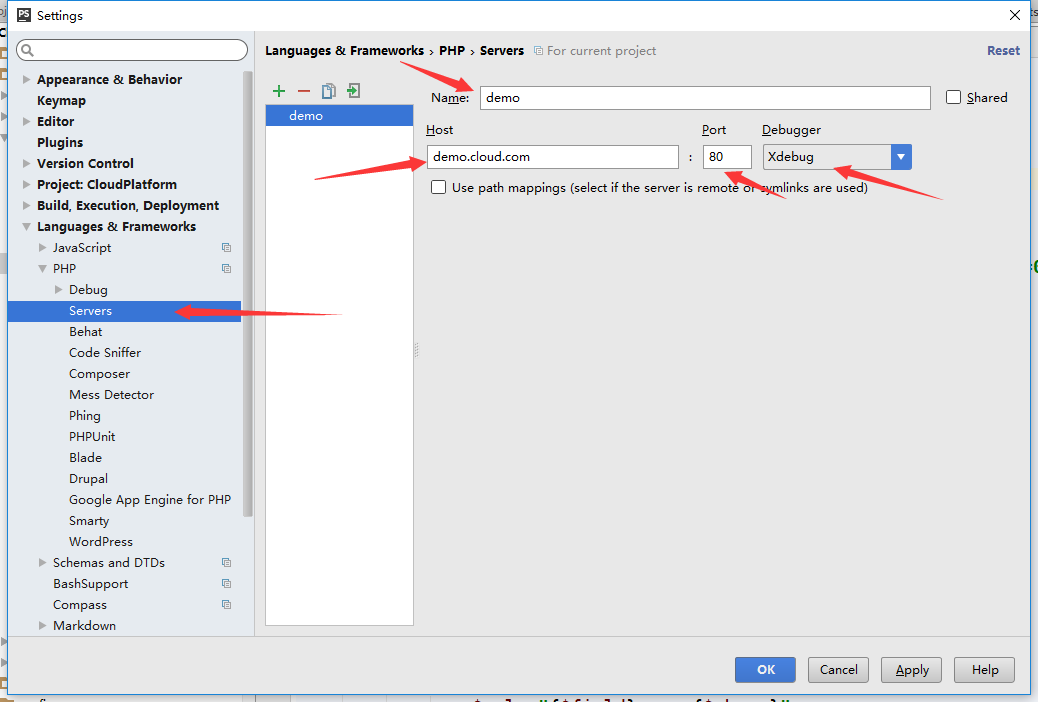
然后打开 Files->Settings->Languages->PHP->Servers 添加一个环境 host 一定要填你项目的环境
Files->Settings->Languages->PHP->Debug
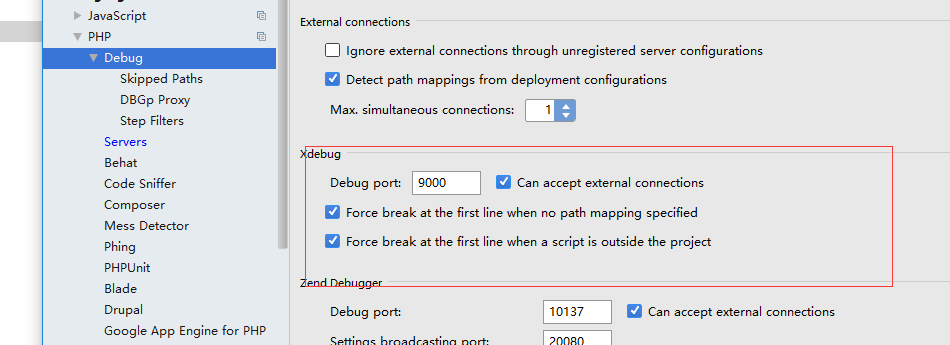

然后打开


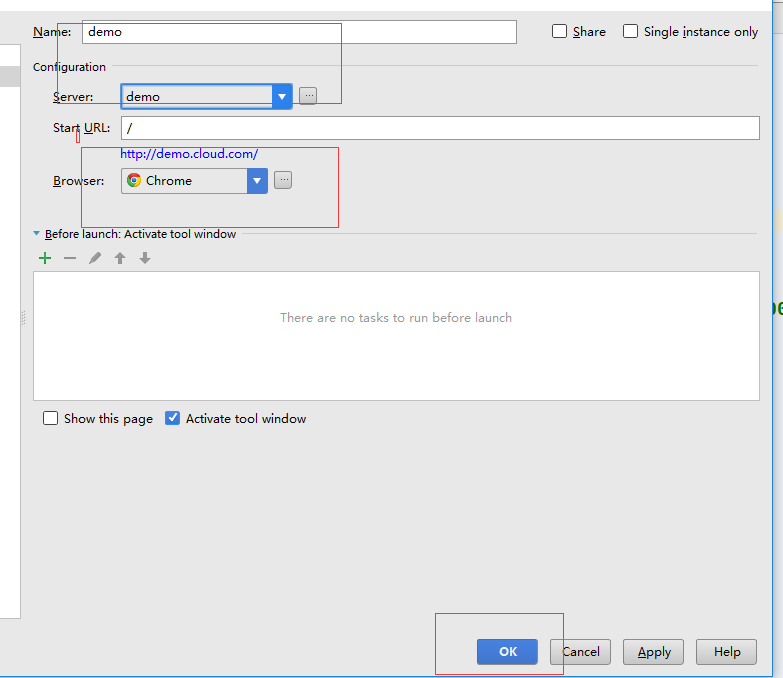
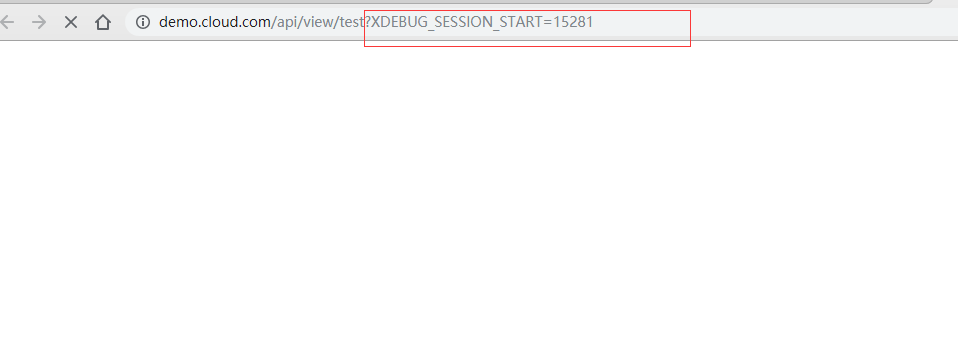
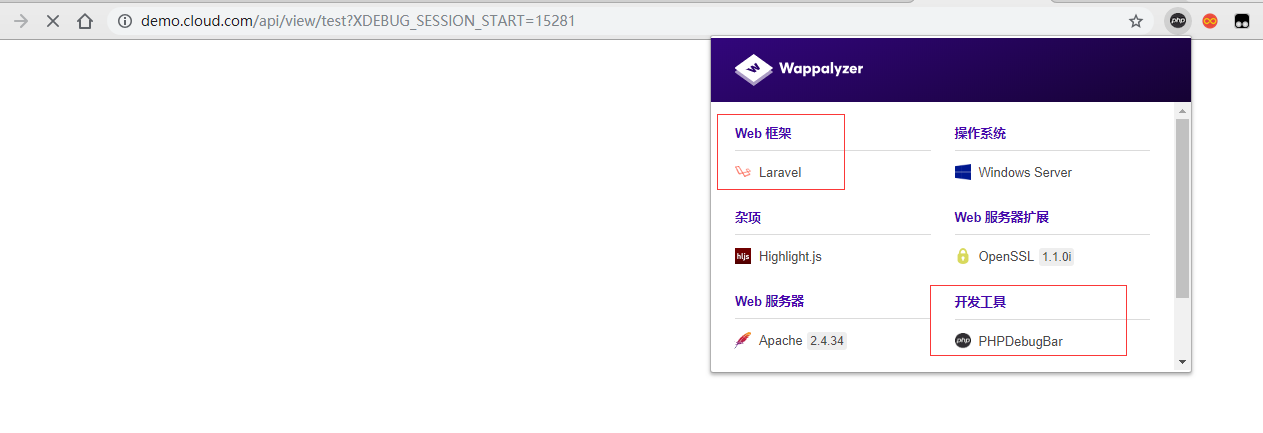
然后点击小虫子 打开的这个参数非常重要
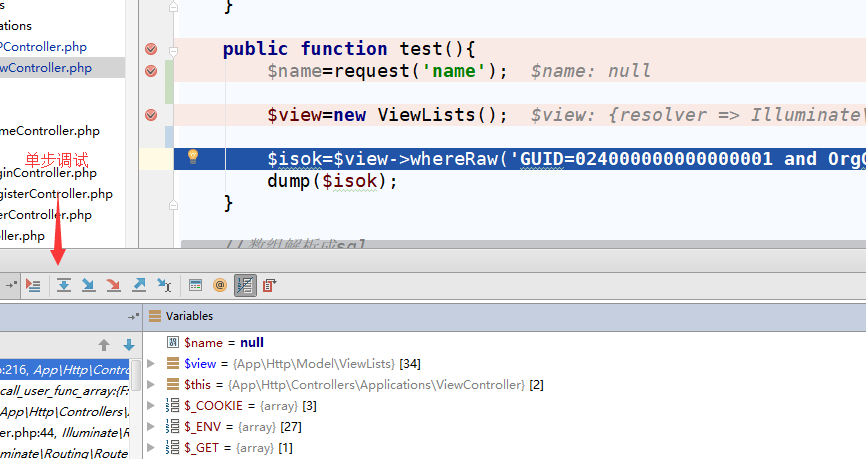
PHPStorm 监听到了

F8 单步调试 F7 进步方法 Shift+F8 跳出方法 常用的了
结束
最新文章
- 微信小程序文件结构
- phpmyadmin连接,管理多个mysql服务器
- Design / UX Consultation
- poj2137 dp
- java学习第七天
- 教你21天学会C++ (有图有真相)
- 【python】python的二元表达式和三元表达式
- BZOJ 3221: [Codechef FEB13] Obserbing the tree树上询问( 可持久化线段树 + 树链剖分 )
- 在ASP.net中的UpdatePanel,弹窗失败解决办法
- webstoem自动编译less文件
- API函数详解:API大全总目录(按字母排列)
- solr云的简单搭建(了解)
- Java上传和下载
- 插入排序(Python实现)
- 怎样从外网访问内网Memcached数据库
- webstorm keys
- JavaScript----特效代码
- [LeetCode&Python] Problem 762. Prime Number of Set Bits in Binary Representation
- linux 软件编译问题汇总
- 网络Socket编程UDP协议例子