python的数字图像处理学习(3)
2024-08-25 15:51:40
高级滤波:
 from skimage import data,color,data_dir

 import matplotlib.pyplot as plt

 from skimage.morphology import disk

 import skimage.filters.rank as sfr

 img =color.rgb2gray(data.camera())

 auto =sfr.autolevel(img, disk(5))  #半径为5的圆形滤波器

 plt.figure('filters',figsize=(8,8))

 plt.subplot(121)

 plt.imshow(img,plt.cm.gray)

 plt.subplot(122)

 plt.imshow(auto,plt.cm.gray)

 data_dir
高级滤波.....
 from skimage import data,color

 import matplotlib.pyplot as plt

 from skimage.morphology import disk

 import skimage.filters.rank as sfr

 img =color.rgb2gray(data.camera())

 auto =sfr.bottomhat(img, disk(5))  #半径为5的圆形滤波器

 auto1 =sfr.tophat(img, disk(5))  #半径为5的圆形滤波器

 plt.figure('filters',figsize=(12,12))

 plt.subplot(131)

 plt.imshow(img,plt.cm.gray)

 plt.subplot(132)

 plt.imshow(auto,plt.cm.gray)

 plt.subplot(133)

 plt.imshow(auto1,plt.cm.gray)
提取轮廓....
 import numpy as np

 import matplotlib.pyplot as plt

 from skimage import measure,draw,data,filters

 #生成二值测试图像

 img=data.page()

 thresh = filters.threshold_isodata(img)

 img1 = (img <= thresh)*1.0   #根据阈值进行分割

 #检测所有图形的轮廓

 img2 = img1[:,:]

 contours = measure.find_contours(img1, 0.5)

 #绘制轮廓

 fig, (ax0,ax1,ax2) = plt.subplots(1,3,figsize=(15,15))

 ax0.imshow(img,plt.cm.gray)

 ax1.imshow(img1,plt.cm.gray)

 ax2.imshow(img2,plt.cm.gray)    #enumerate索引序列

 for n, contour in enumerate(contours):

     ax2.plot(contour[:, 1], contour[:, 0], linewidth=1)

 plt.show()
提取轮廓..............
 import matplotlib.pyplot as plt

 from skimage import measure,data,color

 img=color.rgb2gray(data.horse())

 contours = measure.find_contours(img, 0.5)

 fig, axes = plt.subplots(1,2,figsize=(8,8))

 ax0, ax1= axes.ravel()

 ax0.imshow(img,plt.cm.gray)

 rows,cols=img.shape

 ax1.axis([0,rows,cols,0])

 for n, contour in enumerate(contours):

     ax1.plot(contour[:, 1], contour[:, 0], linewidth=1)

 ax1.axis('image')

 plt.show()
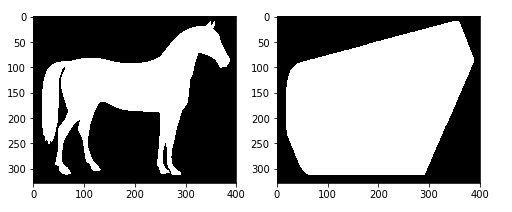
凸包............
import matplotlib.pyplot as plt

from skimage import data,color,morphology

img=color.rgb2gray(data.horse())

img=(img<0.5)*1

chull = morphology.convex_hull_image(img)

fig, axes = plt.subplots(1,2,figsize=(8,8))

ax0, ax1= axes.ravel()

ax0.imshow(img,plt.cm.gray)

ax1.imshow(chull,plt.cm.gray)
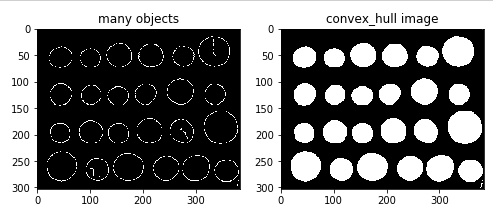
多个凸包.....................................................................................
 import matplotlib.pyplot as plt

 from skimage import data,color,morphology,feature

 img=color.rgb2gray(data.coins())

 edgs=feature.canny(img, sigma=3, low_threshold=10, high_threshold=50)

 chull = morphology.convex_hull_object(edgs)

 #绘制轮廓

 fig, axes = plt.subplots(1,2,figsize=(8,8))

 ax0, ax1= axes.ravel()

 ax0.imshow(edgs,plt.cm.gray)

 ax0.set_title('many objects')

 ax1.imshow(chull,plt.cm.gray)

 ax1.set_title('convex_hull image')

 plt.show()
看不懂也写不下去了...
最新文章
- 7_nodejs angularjs
- 为input输入框添加圆角并去除阴影
- Word Break
- IO碰到的问题
- 转一篇Xcode中利用target编译不同版本的文章
- 手机开发Android模拟器genymotion
- 由mysql数据库基础上的php程序实现单词的查询、删除、更改和查询
- docker exec 运行命令
- 一个小的日常实践——高速Fibonacci数算法
- Python拉勾爬虫——以深圳地区数据分析师为例
- IT轮子系列(二)——mvc API 说明文档的自动生成——Swagger的使用(一)
- SDE与shapefile之间的数据导入与导出
- windows批量停止服务
- React项目新手指南
- 基于js利用经纬度进行两地的距离计算(转)
- python sort、sorted
- Matrix(二分套二分)
- ROS学习笔记十一:创建URDF 文件并在RVIZ中查看模型
- [poj2417]Discrete Logging_BSGS
- canvas 鼠标位置缩放图形