strom ui Topology 可视化视图各个指标含义说明
2024-09-01 08:37:33
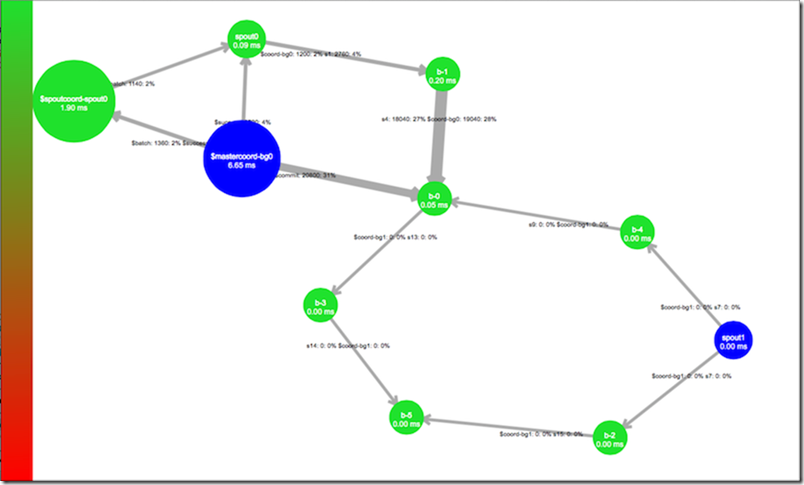
In the visualization, spout components are represented as blue, while bolts are colored between green and red depending on their associated capacity metric. The width of the lines between the components represent the flow of tuples relative to the other visible streams.
storm ui 中的topology可视化的中的指标说明:
spout: 用蓝色的球表示
bolt: 用绿色到红色的球表示,绿色到红色代表了该bolt并行度(capacity metric )相关的指标。
组件之间的线的宽度:数据流的大小(组件之间的线的宽度代表元组数据流相对于其他可见的流)。
组件球的半径大小:
组件上线上的数字:相关联两个组件上传输的数据量trans,百分比为 (trans /totaltrans)*100%, totaltrans是所有组件间传输的数据量的总和。
最新文章
- Java集合---LinkedList源码解析
- 记一次Web服务的性能调优
- 多重背包 (poj 1014)
- 【渗透测试学习平台】 web for pentester -1.介绍与安装
- MySQL ddl丢表
- Java集合之HashMap源码实现分析
- mongDB主从
- java Queue中 add/offer,element/peek,remove/poll区别
- 如何更改Audition的界面颜色
- Python3.7 Scrapy crawl 运行出错解决方法
- RabbitMQ基本操作
- python 字典的定义以及方法
- 还原是不可能还原的,这辈子都不可能还原(手动笑cry)
- Is the “*apply” family really not vectorized?
- js获取iframe中的元素以及在iframe中获取父级的元素(包括iframe中不存在name和id的情况)
- linux常用命令:crontab 命令
- Django之常用命令以及问题汇总
- node-webkit,nwjs 系统托盘【Tray】实践
- [effictive c++] 条款04 确定对象被使用前已被初始化
- multipart/form-data boundary 说明