一款天气app的温度曲线图的实现
最近在开发一款天气app,有一个功能是显示当天24小时每三个小时的气温状况,这个功能无疑要用图表来实现最好了。所以在github上找到一个国人开发的图表库,XCL-Charts。
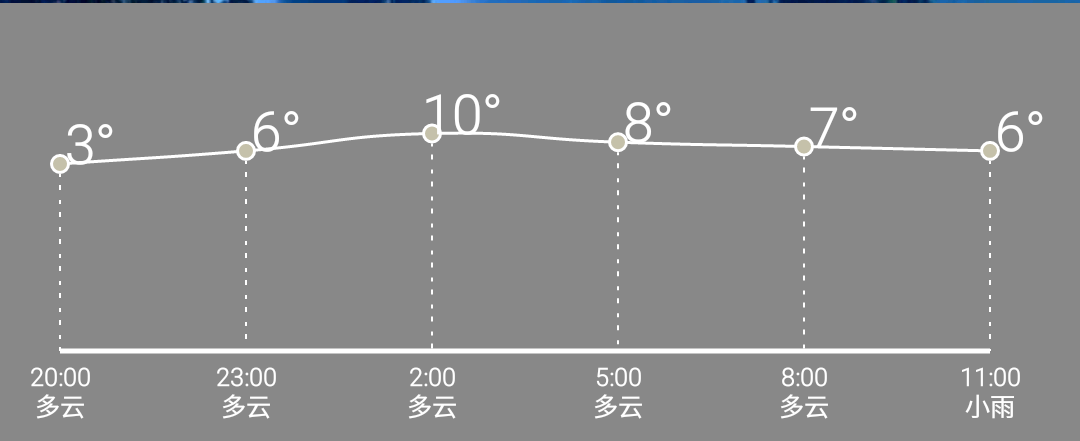
先上效果图:
首先创建一个SplineChartView继承自GraphicalView,再主要实现三个方法
第一个是关于图表的渲染
private void chartRender()
{
try {
        //设置绘图区默认缩进px值,留置空间显示Axis,Axistitle....

        int [] ltrb = getBarLnDefaultSpadding();

        chart.setPadding(ltrb[0] + DensityUtil.dip2px(this.getContext(), 20), ltrb[1],

                    ltrb[2]+DensityUtil.dip2px(this.getContext(), 30), ltrb[3]);

        //显示边框

        chart.showRoundBorder();

        //数据源

        chart.setCategories(labels);

        chart.setDataSource(chartData);

    //  chart.setCustomLines(mCustomLineDataset);

        //坐标系

        //数据轴最大值

        chart.getDataAxis().setAxisMax(40);

        chart.getDataAxis().setAxisMin(-40);

        //数据轴刻度间隔

        chart.getDataAxis().setAxisSteps(2);

        //标签轴最大值

        chart.setCategoryAxisMax(5);

        //标签轴最小值

        chart.setCategoryAxisMin(0);

        //背景网格

        PlotGrid plot = chart.getPlotGrid();

        plot.hideHorizontalLines();

        plot.hideVerticalLines();

        chart.getPlotArea().setBackgroundColor(true, Color.GRAY);

        chart.getCategoryAxis().getAxisPaint().setColor(Color.WHITE);

        chart.getCategoryAxis().getAxisPaint().setTextSize(6);

        chart.getCategoryAxis().hideTickMarks();

        chart.getCategoryAxis().getTickLabelPaint().setColor(Color.WHITE);

        chart.getCategoryAxis().getTickLabelPaint().setFakeBoldText(true);

        chart.getCategoryAxis().setTickLabelMargin(25);

        chart.getCategoryAxis().getTickLabelPaint().setTextSize(25);

        //不使用精确计算,忽略Java计算误差,提高性能

        chart.disableHighPrecision();

        chart.disablePanMode();

        chart.hideBorder();

        chart.getPlotLegend().hide();

        chart.getDataAxis().hide();

    } catch (Exception e) {

        // TODO Auto-generated catch block

        e.printStackTrace();

        Log.e("tag", e.toString());

    }

}
其中chart.getPlotArea().setBackgroundColor(true, Color.GRAY);是设置图表绘制区的颜色,chart.getDataAxis().setAxisMax(40);在我的app中表示能显示的最高温度是40摄氏度,chart.getDataAxis().setAxisMin(-40);表示能显示的最低温度是-40摄氏度。
第二个和第三个都是绑定数据的。
public void setChartDataSet(List temps)
{
//线1的数据集
List linePoint1 = new ArrayList();
linePoint1.add(new PointD(0d, Double.parseDouble(temps.get(0))));
linePoint1.add(new PointD(1d, Double.parseDouble(temps.get(1))));
linePoint1.add(new PointD(2d, Double.parseDouble(temps.get(2))));
linePoint1.add(new PointD(3d, Double.parseDouble(temps.get(3))));
linePoint1.add(new PointD(4d, Double.parseDouble(temps.get(4))));
linePoint1.add(new PointD(5d, Double.parseDouble(temps.get(5))));
    SplineData dataSeries1 = new SplineData("Go",linePoint1,

            Color.WHITE );

    //把线弄细点

    dataSeries1.getLinePaint().setStrokeWidth(3);

    dataSeries1.setLineStyle(XEnum.LineStyle.DASH);

    dataSeries1.setLabelVisible(false);

    dataSeries1.setDotStyle(XEnum.DotStyle.RING);

    dataSeries1.getDotPaint().setColor(getResources().getColor(R.color.white));

    dataSeries1.getPlotLine().getPlotDot().setRingInnerColor(getResources().getColor(R.color.grey));

    chartData.add(dataSeries1);

    this.invalidate();

}

public void setChartLabels(List<String> weather){

    String[] times={"20:00\n","23:00\n","2:00\n","5:00\n","8:00\n","11:00\n"};

    for(int i=0;i<weather.size();i++){

        labels.add(times[i]+weather.get(i));

    }

    this.invalidate();

}

由于需要动态添加数据,也就是温度,这里我设置了6个时段的温度,每个时段三个小时。在setChartDataSet方法中添加了参数,dataSeries1.getLinePaint().setStrokeWidth(3);设置了绘制曲线的线宽度,dataSeries1.setLineStyle(XEnum.LineStyle.DASH)设置了曲线的类型。setChartLabels(List<String> weather)设置了横轴坐标表示什么意思,在这里表示时段和天气状态。
第四个是图批注
public void setChartAnchor(List<String> temps){

    //激活点击监听

            chart.ActiveListenItemClick();

            //为了让触发更灵敏,可以扩大5px的点击监听范围

            chart.extPointClickRange(5);

            chart.showClikedFocus();

            //批注

            List<AnchorDataPoint> mAnchorSet = new ArrayList<AnchorDataPoint>();

            AnchorDataPoint an2 = new AnchorDataPoint(0,0,XEnum.AnchorStyle.TOBOTTOM);

            an2.setBgColor(Color.WHITE);

            an2.setLineWidth(15);

            an2.setLineStyle(XEnum.LineStyle.DASH);

            an2.setTextColor(Color.WHITE);

            an2.setTextSize(55);

            an2.setAnchor(temps.get(0));

            AnchorDataPoint an3 = new AnchorDataPoint(0,1,XEnum.AnchorStyle.TOBOTTOM);

            an3.setBgColor(Color.WHITE);

            an3.setLineStyle(XEnum.LineStyle.DASH);

            an3.setTextColor(Color.WHITE);

            an3.setTextSize(55);

            an3.setAnchor(temps.get(1));

            //从点到底的标识线

            //从点到底的标识线

            AnchorDataPoint an4 = new AnchorDataPoint(0,2,XEnum.AnchorStyle.TOBOTTOM);

            an4.setBgColor(Color.WHITE);

            an4.setLineWidth(15);

            an4.setLineStyle(XEnum.LineStyle.DASH);

            an4.setTextColor(Color.WHITE);

            an4.setTextSize(55);

            an4.setAnchor(temps.get(2));

            AnchorDataPoint an5 = new AnchorDataPoint(0,3,XEnum.AnchorStyle.TOBOTTOM);

            an5.setBgColor(Color.WHITE);

            an5.setLineWidth(15);

            an5.setLineStyle(XEnum.LineStyle.DASH);

            an5.setTextColor(Color.WHITE);

            an5.setTextSize(55);

            an5.setAnchor(temps.get(3));

            AnchorDataPoint an6 = new AnchorDataPoint(0,4,XEnum.AnchorStyle.TOBOTTOM);

            an6.setBgColor(Color.WHITE);

            an6.setLineWidth(15);

            an6.setLineStyle(XEnum.LineStyle.DASH);

            an6.setTextColor(Color.WHITE);

            an6.setTextSize(55);

            an6.setAnchor(temps.get(4));

            AnchorDataPoint an7 = new AnchorDataPoint(0,5,XEnum.AnchorStyle.TOBOTTOM);

            an7.setBgColor(Color.WHITE);

            an7.setLineWidth(15);

            an7.setLineStyle(XEnum.LineStyle.DASH);

            an7.setTextColor(Color.WHITE);

            an7.setTextSize(55);

            an7.setAnchor(temps.get(5));

            mAnchorSet.add(an2);

            mAnchorSet.add(an3);

            mAnchorSet.add(an4);

            mAnchorSet.add(an5);

            mAnchorSet.add(an6);

            mAnchorSet.add(an7);

            chart.setAnchorDataPoint(mAnchorSet);

            this.invalidate();

}
an2.setBgColor(Color.WHITE);
an2.setLineWidth(15);
an2.setLineStyle(XEnum.LineStyle.DASH);
an2.setTextColor(Color.WHITE);
an2.setTextSize(55);
an2.setAnchor(temps.get(0));
上面第一行依然是设置背景色为白色,第二行是批注线的宽度,第三行是设置批注线为虚线,第四、五行设置了批注文字的颜色和大小,第六行则是将批注文字绑定到an2上。
附上完整代码
package com.example.springweather.customview;
import java.util.ArrayList;
import java.util.LinkedList;
import java.util.List;
import org.xclcharts.chart.PointD;
import org.xclcharts.chart.SplineChart;
import org.xclcharts.chart.SplineData;
import org.xclcharts.common.DensityUtil;
import org.xclcharts.renderer.XEnum;
import org.xclcharts.renderer.info.AnchorDataPoint;
import org.xclcharts.renderer.plot.PlotGrid;
import org.xclcharts.view.ChartView;
import org.xclcharts.view.GraphicalView;
import com.example.springweather.R;
import android.content.Context;
import android.graphics.Canvas;
import android.graphics.Color;
import android.graphics.Paint;
import android.util.AttributeSet;
import android.util.Log;
public class SplineChartView extends GraphicalView {
private SplineChart chart = new SplineChart();
//分类轴标签集合
private LinkedList labels = new LinkedList();
private LinkedList chartData = new LinkedList();
Paint pToolTip = new Paint(Paint.ANTI_ALIAS_FLAG);
public SplineChartView(Context context) {

    super(context);

    // TODO Auto-generated constructor stub

    initView();

}

public SplineChartView(Context context, AttributeSet attrs){

    super(context, attrs);

    initView();

 }

 public SplineChartView(Context context, AttributeSet attrs, int defStyle) {

        super(context, attrs, defStyle);

        initView();

 }

@Override

public void refreshChart() {

    super.refreshChart();

    labels.clear();

    chartData.clear();

}

 private void initView()

 {

        List<String> weather=new ArrayList<String>();

        for(int i=0;i<6;i++){

            weather.add("晴");

        }

        List<String> temps=new ArrayList<String>();

        for(int i=0;i<6;i++){

            temps.add("1");

        }

        setChartLabels(weather);

        setChartDataSet(temps);

        setChartAnchor(temps);

        chartRender();

 }

@Override

protected void onSizeChanged(int w, int h, int oldw, int oldh) {

    super.onSizeChanged(w, h, oldw, oldh);

   //图所占范围大小

    chart.setChartRange(w,h);

}

protected int[] getBarLnDefaultSpadding()

{

    int [] ltrb = new int[4];

    ltrb[0] = DensityUtil.dip2px(getContext(), 0); //left

    ltrb[1] = DensityUtil.dip2px(getContext(), 0); //top

    ltrb[2] = DensityUtil.dip2px(getContext(), 0); //right

    ltrb[3] = DensityUtil.dip2px(getContext(), 30); //bottom

    return ltrb;

}

private void chartRender()

{

    try {

        //设置绘图区默认缩进px值,留置空间显示Axis,Axistitle....

        int [] ltrb = getBarLnDefaultSpadding();

        chart.setPadding(ltrb[0] + DensityUtil.dip2px(this.getContext(), 20), ltrb[1],

                    ltrb[2]+DensityUtil.dip2px(this.getContext(), 30), ltrb[3]);

        //显示边框

        chart.showRoundBorder();

        //数据源

        chart.setCategories(labels);

        chart.setDataSource(chartData);

    //  chart.setCustomLines(mCustomLineDataset);

        //坐标系

        //数据轴最大值

        chart.getDataAxis().setAxisMax(40);

        chart.getDataAxis().setAxisMin(-40);

        //数据轴刻度间隔

        chart.getDataAxis().setAxisSteps(2);

        //标签轴最大值

        chart.setCategoryAxisMax(5);

        //标签轴最小值

        chart.setCategoryAxisMin(0);

        //背景网格

        PlotGrid plot = chart.getPlotGrid();

        plot.hideHorizontalLines();

        plot.hideVerticalLines();

        chart.getPlotArea().setBackgroundColor(true, Color.GRAY);

        chart.getCategoryAxis().getAxisPaint().setColor(Color.WHITE);

        chart.getCategoryAxis().getAxisPaint().setTextSize(6);

        chart.getCategoryAxis().hideTickMarks();

        chart.getCategoryAxis().getTickLabelPaint().setColor(Color.WHITE);

        chart.getCategoryAxis().getTickLabelPaint().setFakeBoldText(true);

        chart.getCategoryAxis().setTickLabelMargin(25);

        chart.getCategoryAxis().getTickLabelPaint().setTextSize(25);

        //不使用精确计算,忽略Java计算误差,提高性能

        chart.disableHighPrecision();

        chart.disablePanMode();

        chart.hideBorder();

        chart.getPlotLegend().hide();

        chart.getDataAxis().hide();

    } catch (Exception e) {

        // TODO Auto-generated catch block

        e.printStackTrace();

        Log.e("tag", e.toString());

    }

}

public void setChartDataSet(List<String> temps)

{

    //线1的数据集

    List<PointD> linePoint1 = new ArrayList<PointD>();

    linePoint1.add(new PointD(0d, Double.parseDouble(temps.get(0))));

    linePoint1.add(new PointD(1d, Double.parseDouble(temps.get(1))));

    linePoint1.add(new PointD(2d, Double.parseDouble(temps.get(2))));

    linePoint1.add(new PointD(3d, Double.parseDouble(temps.get(3))));

    linePoint1.add(new PointD(4d, Double.parseDouble(temps.get(4))));

    linePoint1.add(new PointD(5d, Double.parseDouble(temps.get(5))));

    SplineData dataSeries1 = new SplineData("Go",linePoint1,

            Color.WHITE );

    //把线弄细点

    dataSeries1.getLinePaint().setStrokeWidth(3);

    dataSeries1.setLineStyle(XEnum.LineStyle.DASH);

    dataSeries1.setLabelVisible(false);

    dataSeries1.setDotStyle(XEnum.DotStyle.RING);

    dataSeries1.getDotPaint().setColor(getResources().getColor(R.color.white));

    dataSeries1.getPlotLine().getPlotDot().setRingInnerColor(getResources().getColor(R.color.grey));

    chartData.add(dataSeries1);

    this.invalidate();

}

public void setChartLabels(List<String> weather){

    String[] times={"20:00\n","23:00\n","2:00\n","5:00\n","8:00\n","11:00\n"};

    for(int i=0;i<weather.size();i++){

        labels.add(times[i]+weather.get(i));

    }

    this.invalidate();

}

public void setChartAnchor(List<String> temps){

    //激活点击监听

            chart.ActiveListenItemClick();

            //为了让触发更灵敏,可以扩大5px的点击监听范围

            chart.extPointClickRange(5);

            chart.showClikedFocus();

            //批注

            List<AnchorDataPoint> mAnchorSet = new ArrayList<AnchorDataPoint>();

            AnchorDataPoint an2 = new AnchorDataPoint(0,0,XEnum.AnchorStyle.TOBOTTOM);

            an2.setBgColor(Color.WHITE);

            an2.setLineWidth(15);

            an2.setLineStyle(XEnum.LineStyle.DASH);

            an2.setTextColor(Color.WHITE);

            an2.setTextSize(55);

            an2.setAnchor(temps.get(0));

            AnchorDataPoint an3 = new AnchorDataPoint(0,1,XEnum.AnchorStyle.TOBOTTOM);

            an3.setBgColor(Color.WHITE);

            an3.setLineStyle(XEnum.LineStyle.DASH);

            an3.setTextColor(Color.WHITE);

            an3.setTextSize(55);

            an3.setAnchor(temps.get(1));

            //从点到底的标识线

            //从点到底的标识线

            AnchorDataPoint an4 = new AnchorDataPoint(0,2,XEnum.AnchorStyle.TOBOTTOM);

            an4.setBgColor(Color.WHITE);

            an4.setLineWidth(15);

            an4.setLineStyle(XEnum.LineStyle.DASH);

            an4.setTextColor(Color.WHITE);

            an4.setTextSize(55);

            an4.setAnchor(temps.get(2));

            AnchorDataPoint an5 = new AnchorDataPoint(0,3,XEnum.AnchorStyle.TOBOTTOM);

            an5.setBgColor(Color.WHITE);

            an5.setLineWidth(15);

            an5.setLineStyle(XEnum.LineStyle.DASH);

            an5.setTextColor(Color.WHITE);

            an5.setTextSize(55);

            an5.setAnchor(temps.get(3));

            AnchorDataPoint an6 = new AnchorDataPoint(0,4,XEnum.AnchorStyle.TOBOTTOM);

            an6.setBgColor(Color.WHITE);

            an6.setLineWidth(15);

            an6.setLineStyle(XEnum.LineStyle.DASH);

            an6.setTextColor(Color.WHITE);

            an6.setTextSize(55);

            an6.setAnchor(temps.get(4));

            AnchorDataPoint an7 = new AnchorDataPoint(0,5,XEnum.AnchorStyle.TOBOTTOM);

            an7.setBgColor(Color.WHITE);

            an7.setLineWidth(15);

            an7.setLineStyle(XEnum.LineStyle.DASH);

            an7.setTextColor(Color.WHITE);

            an7.setTextSize(55);

            an7.setAnchor(temps.get(5));

            mAnchorSet.add(an2);

            mAnchorSet.add(an3);

            mAnchorSet.add(an4);

            mAnchorSet.add(an5);

            mAnchorSet.add(an6);

            mAnchorSet.add(an7);

            chart.setAnchorDataPoint(mAnchorSet);

            this.invalidate();

}

@Override

public void render(Canvas canvas) {

    try{

        canvas.drawColor(Color.GRAY);

        chart.render(canvas);

    } catch (Exception e){

        Log.e("tag", e.toString());

    }

}
}
最新文章
- Python的平凡之路(4)
- 【Unity】12.5 Navmesh Obstacle组件
- APIO2015
- 【转】C#中HttpWebRequest的用法详解
- android目录
- 【Linux高频命令专题(15)】more
- mongodb 常见操作转
- 基于 Jenkins 快速搭建持续集成环境--转
- 编译Release版本小技巧
- Angular中ngModel的$render的详解
- 内核对象kobject和sysfs(4)——kset分析
- 设计一下类似SpringIoC的注入工具~Lind.DI
- ansible_playbook 一键搭建集群架构
- 如何使a标签打开新页面并阻止刷新当前页面
- 安装FP
- python 计时器
- 提高sql2005中带freetexttable和rank的全文检索的速度
- 【异常】Application failed to start due to an exception org.springframework.beans.factory.BeanCurrentlyInCreationException
- 「七天自制PHP框架」应用:Model外键链接
- WIFI配置专项测试