R语言低级绘图函数-axis
2024-08-22 09:36:29
axis函数用来在一张图表上添加轴线,区别于传统的x轴和y轴,axis 允许在上,下,左, 右4个方向添加轴线
以x轴为例,一条轴线包含3个元素,水平的一条横线,叫做axis line , 刻度线, 叫做tick line, 对应的标签 labels
基本用法:
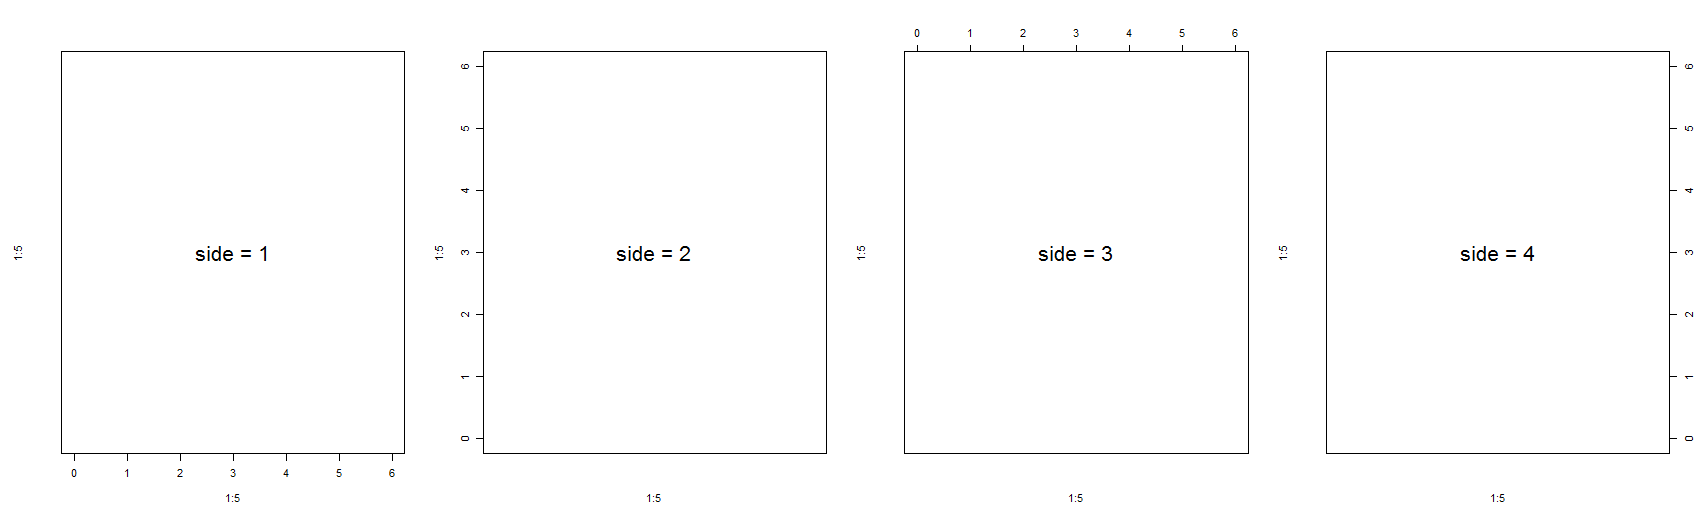
通过side 参数设置需要添加的轴线的方向,从下边开始,沿逆时针方向,数字为1到4
代码示例:
par(oma = c(1, 1, 1, 1), mfrow = c(1, 4))

plot(1:5, 1:5, xlim = c(0,6), ylim = c (0,6), type = "n", axes = F)

text(x = 3, y = 3, labels = "side = 1", cex = 2)

box()

axis(side = 1)

plot(1:5, 1:5, xlim = c(0,6), ylim = c (0,6), type = "n", axes = F)

text(x = 3, y = 3, labels = "side = 2", cex = 2)

box()

axis(side = 2)

plot(1:5, 1:5, xlim = c(0,6), ylim = c (0,6), type = "n", axes = F)

text(x = 3, y = 3, labels = "side = 3", cex = 2)

box()

axis(side = 3)

plot(1:5, 1:5, xlim = c(0,6), ylim = c (0,6), type = "n", axes = F)

text(x = 3, y = 3, labels = "side = 4", cex = 2)

box()

axis(side = 4)
效果图如下:
参数设置:
at : 需要添加刻度的数值,默认会根据变量的取值范围计算几个合适的刻度,也可以手工指定
代码示例:
plot(1:5, 1:5, xlim = c(0,6), ylim = c (0,6), type = "n", axes = F)

box()

axis(side = 1, at = c(0, 2, 4, 6))
效果图如下:

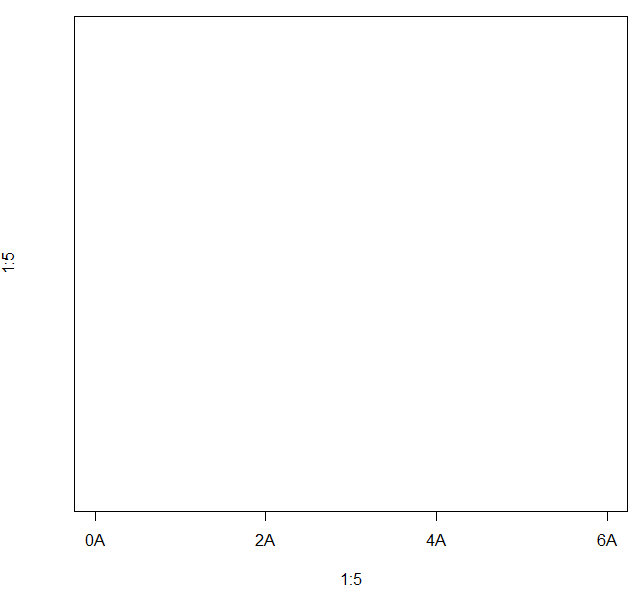
lables : 指定在刻度上需要标记的内容,默认就是刻度对应的值
代码示例:
plot(1:5, 1:5, xlim = c(0,6), ylim = c (0,6), type = "n", axes = F)

box()

axis(side = 1, at = c(0, 2, 4, 6), labels = paste(c(0, 2, 4, 6), "A", sep = ""))
效果图如下:
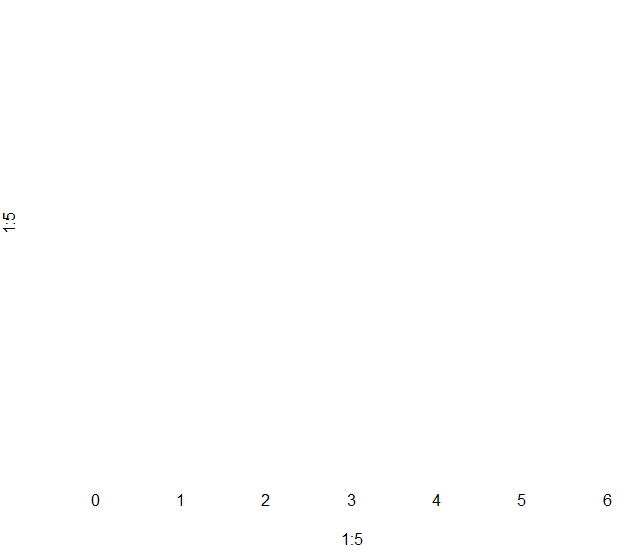
tick : 逻辑值,是否显示轴线,包括刻度线和对应的轴线, FALSE 表示不显示
代码示例:
plot(1:5, 1:5, xlim = c(0,6), ylim = c (0,6), type = "n", axes = F)

axis(side = 1, tick = F)
效果图:
line : 轴线的位置
代码示例:
plot(1:5, 1:5, xlim = c(0,6), ylim = c (0,6), type = "n", axes = F)

box()

axis(side = 1, line = 1)
效果图如下:

lwd : 设置 axis line 和 tick line 的宽度
代码示例:
plot(1:5, 1:5, xlim = c(0,6), ylim = c (0,6), type = "n", axes = F)

box()

axis(side = 1, line = 1, lwd = 2)
效果图如下:

lwd.tick : 设置tick line的宽度
代码示例:
plot(1:5, 1:5, xlim = c(0,6), ylim = c (0,6), type = "n", axes = F)

box()

axis(side = 1, line = 1, lwd = 1, lwd.tick = 2)
效果图如下:
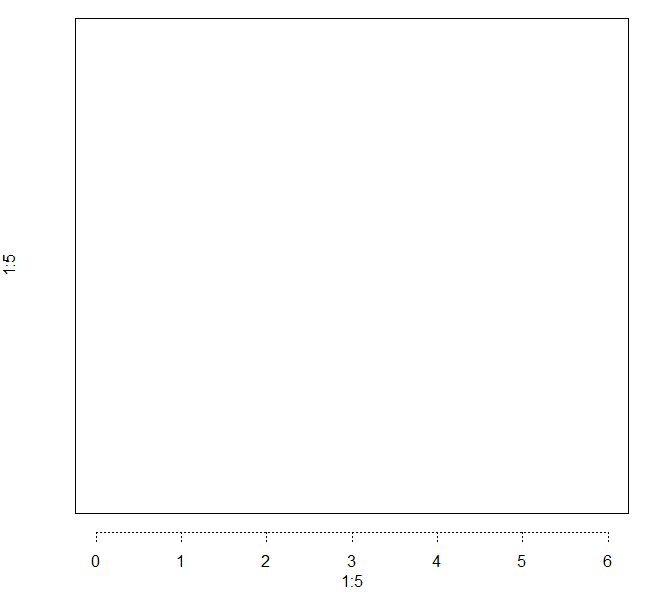
lty : 设置axis line 和tick line的线条类型
代码示例:
plot(1:5, 1:5, xlim = c(0,6), ylim = c (0,6), type = "n", axes = F)

box()

axis(side = 1, line = 1, lty = 3)
效果图如下:
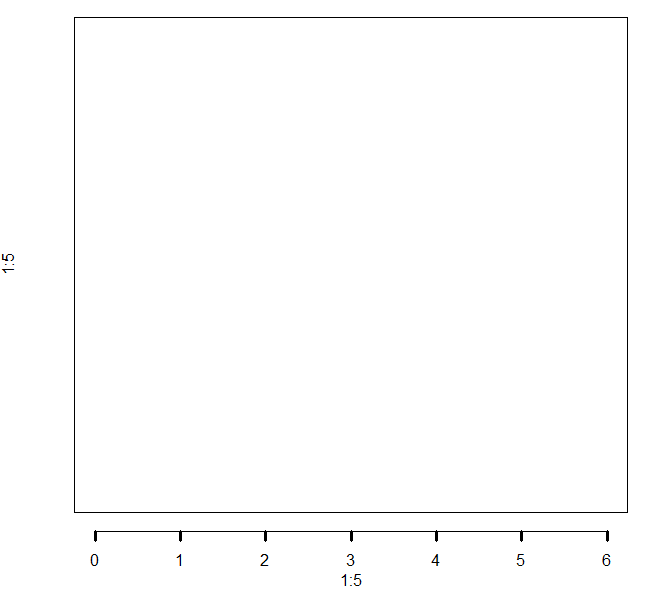
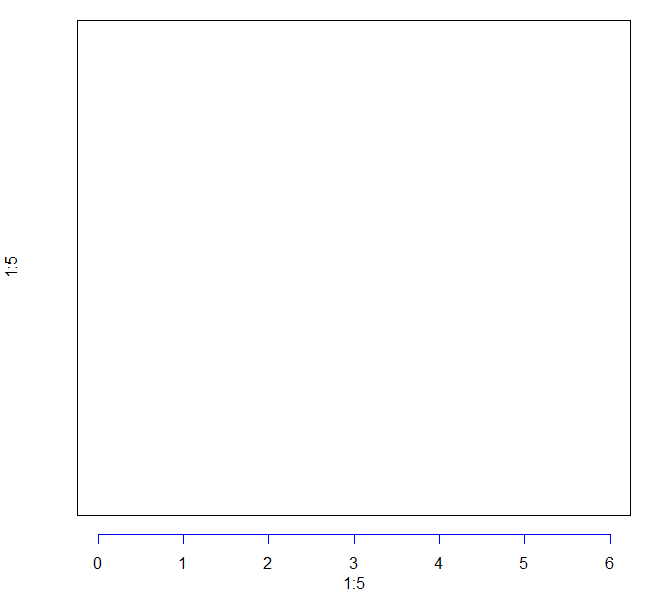
col : 设置axis line 和 tick.line 的线条颜色
代码示例:
plot(1:5, 1:5, xlim = c(0,6), ylim = c (0,6), type = "n", axes = F)

box()

axis(side = 1, line = 1, col = "blue")
效果图如下:
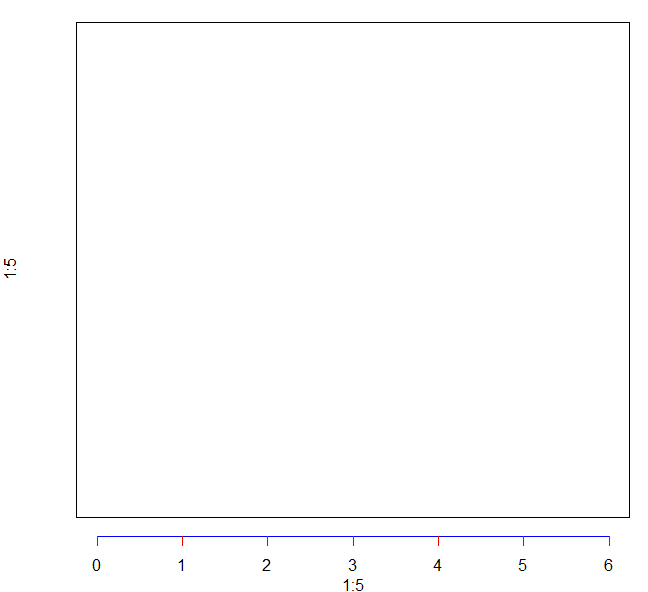
col.ticks : 设置tick line的颜色
代码示例:
plot(1:5, 1:5, xlim = c(0,6), ylim = c (0,6), type = "n", axes = F)

box()

axis(side = 1, line = 1, col = "blue", col.ticks = "red")
效果图如下:
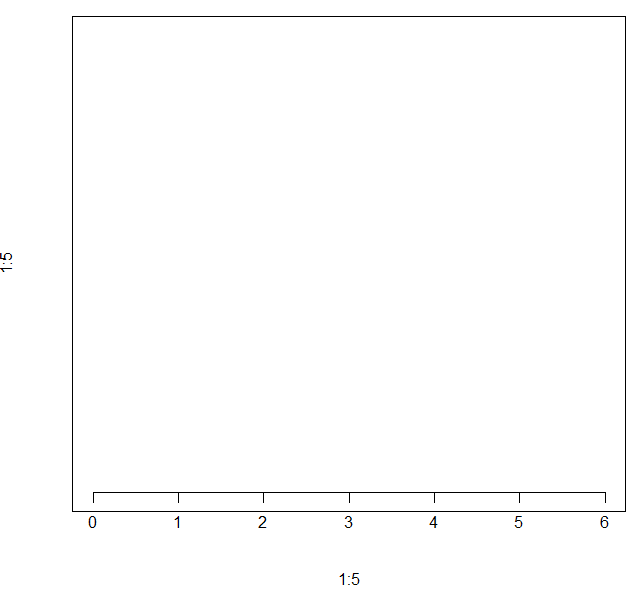
pos : 对轴线的位置进行调整,当pos 设置了对应的值之后会覆盖line 参数的值
代码示例:
plot(1:5, 1:5, xlim = c(0,6), ylim = c (0,6), type = "n", axes = F)

box()

axis(side = 1, pos = 1)
效果图如下:
最新文章
- 页面之间传值方式的总结,五种方式,通知,block,代理,单例,NSUERDEFALUT,
- 2.oracle 12c 创建-访问-关闭-删除PDB
- Please allow Subclipse team to receive anonymous usage statistics for this Eclipse intance(info)
- Tomcat部署Solr4.10.4
- aws在线技术峰会笔记-电商解决方案
- 在Eclipse添加Android兼容包( v4、v7 appcompat )
- 关于C++单件模式释放对象
- 【leetcode❤python】Convert a Number to Hexadecimal
- iOS事件处理之七种手势
- bundle install rake-10.4.2
- Kinect For Windows V2开发日志六:人体的轮廓的表示
- hdu2121 - Ice_cream’s world II(朱刘算法,不固定根)
- 初步掌握HBase
- visualSVN server库迁移(转)
- mac/unix系统:C++实现一个端口扫描器
- Spring MVC(四)文件上传
- [转][C#]ImageHelper
- Confluence 6 升级 Confluence 使用数据源
- webapp用户身份认证方案 JSON WEB TOKEN 实现
- 【转】Code First 属性详解
热门文章
- 由于CentOS的系统安装了epel-release-latest-7.noarch.rpm 导致在使用yum命令时出现Error: xz compression not available问题
- c语言中使用宏,需要注意的的几点
- Django内置过滤器详解附代码附效果图--附全部内置过滤器帮助文档
- 服务器搭建1 安装mysql数据库
- python(28)获得网卡的IP地址,如何在其他文件夹中导入python模块
- hdoj 2717 Catch That Cow
- Ribbon的配置
- tomcat 8 加 struts2的 java.lang.NoSuchFieldException: resourceEntries
- dp之多维背包hdu4501
- Maven学习之(三)Maven插件创建web项目