利用sklearn对多分类的每个类别进行指标评价
今天晚上,笔者接到客户的一个需要,那就是:对多分类结果的每个类别进行指标评价,也就是需要输出每个类型的精确率(precision),召回率(recall)以及F1值(F1-score)。
对于这个需求,我们可以用sklearn来解决,方法并没有难,笔者在此仅做记录,供自己以后以及读者参考。
我们模拟的数据如下:
y_true = ['北京', '上海', '成都', '成都', '上海', '北京', '上海', '成都', '北京', '上海']

y_pred = ['北京', '上海', '成都', '上海', '成都', '成都', '上海', '成都', '北京', '上海']
其中y_true为真实数据,y_pred为多分类后的模拟数据。使用sklearn.metrics中的classification_report即可实现对多分类的每个类别进行指标评价。
示例的Python代码如下:
# -*- coding: utf-8 -*-

from sklearn.metrics import classification_report

y_true = ['北京', '上海', '成都', '成都', '上海', '北京', '上海', '成都', '北京', '上海']

y_pred = ['北京', '上海', '成都', '上海', '成都', '成都', '上海', '成都', '北京', '上海']

t = classification_report(y_true, y_pred, target_names=['北京', '上海', '成都'])

print(t)
输出结果如下:
              precision    recall  f1-score   support

          北京       0.75      0.75      0.75         4

          上海       1.00      0.67      0.80         3

          成都       0.50      0.67      0.57         3

    accuracy                           0.70        10

   macro avg       0.75      0.69      0.71        10

weighted avg       0.75      0.70      0.71        10
需要注意的是,输出的结果数据类型为str,如果需要使用该输出结果,则可将该方法中的output_dict参数设置为True,此时输出的结果如下:
{'北京': {'precision': 0.75, 'recall': 0.75, 'f1-score': 0.75, 'support': 4},
'上海': {'precision': 1.0, 'recall': 0.6666666666666666, 'f1-score': 0.8, 'support': 3},
'成都': {'precision': 0.5, 'recall': 0.6666666666666666, 'f1-score': 0.5714285714285715, 'support': 3},
'accuracy': 0.7,
'macro avg': {'precision': 0.75, 'recall': 0.6944444444444443, 'f1-score': 0.7071428571428572, 'support': 10},
'weighted avg': {'precision': 0.75, 'recall': 0.7, 'f1-score': 0.7114285714285715, 'support': 10}}
使用confusion_matrix方法可以输出该多分类问题的混淆矩阵,代码如下:
from sklearn.metrics import confusion_matrix

y_true = ['北京', '上海', '成都', '成都', '上海', '北京', '上海', '成都', '北京', '上海']

y_pred = ['北京', '上海', '成都', '上海', '成都', '成都', '上海', '成都', '北京', '上海']

print(confusion_matrix(y_true, y_pred, labels = ['北京', '上海', '成都']))
输出结果如下:
[[2 0 1]

 [0 3 1]

 [0 1 2]]
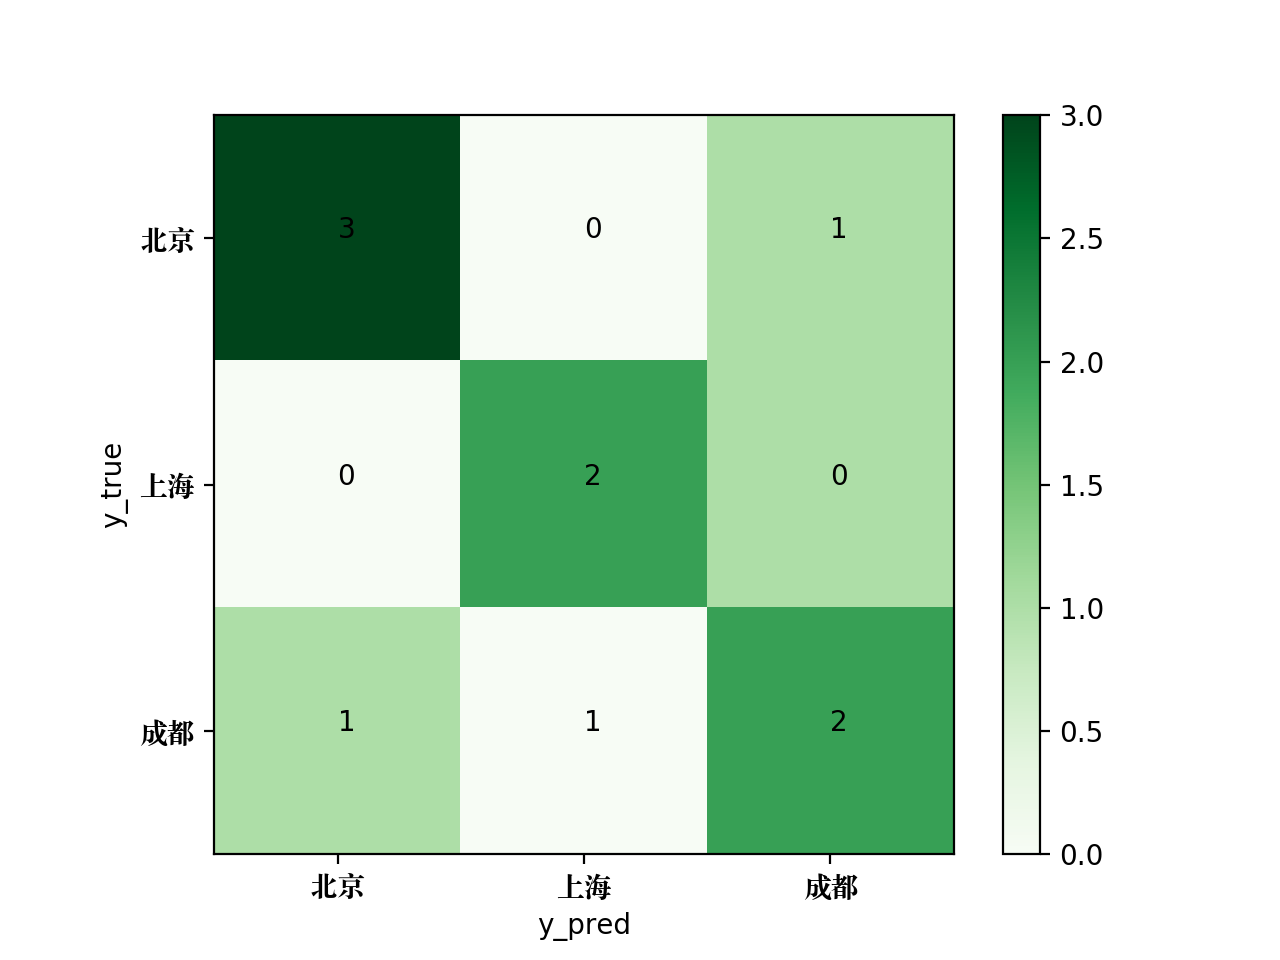
为了将该混淆矩阵绘制成图片,可使用如下的Python代码:
# -*- coding: utf-8 -*-

# author: Jclian91

# place: Daxing Beijing

# time: 2019-11-14 21:52

from sklearn.metrics import confusion_matrix

import matplotlib.pyplot as plt

import matplotlib as mpl

# 支持中文字体显示, 使用于Mac系统

zhfont=mpl.font_manager.FontProperties(fname="/Library/Fonts/Songti.ttc")

y_true = ['北京', '上海', '成都', '成都', '上海', '北京', '上海', '成都', '北京', '上海']

y_pred = ['北京', '上海', '成都', '上海', '成都', '成都', '上海', '成都', '北京', '上海']

classes = ['北京', '上海', '成都']

confusion = confusion_matrix(y_true, y_pred)

# 绘制热度图

plt.imshow(confusion, cmap=plt.cm.Greens)

indices = range(len(confusion))

plt.xticks(indices, classes, fontproperties=zhfont)

plt.yticks(indices, classes, fontproperties=zhfont)

plt.colorbar()

plt.xlabel('y_pred')

plt.ylabel('y_true')

# 显示数据

for first_index in range(len(confusion)):

    for second_index in range(len(confusion[first_index])):

        plt.text(first_index, second_index, confusion[first_index][second_index])

# 显示图片

plt.show()
生成的混淆矩阵图片如下:
本次分享到此结束,感谢大家阅读,也感谢在北京大兴待的这段日子,当然还会再待一阵子~
最新文章
- git 源代码下载和安装(CentOS)
- jquery 进阶
- Oracle 表分组 group by和模糊查询like
- 如何把excel数据导入数据库
- git_sop 脚本使用说明
- AlloyTouch实现下拉刷新
- CentOS 7 下使用 Firewall
- Git提交引用和引用日志
- strcmp和==比较
- JSP(一)
- EF数据存贮问题二之“无法定义这两个对象之间的关系,因为它们附加到不同的 ObjectContext 对象”
- 合并k个已排序的链表 分类: leetcode 算法 2015-07-09 17:43 3人阅读 评论(0) 收藏
- 【python】按行切分文本文件
- php zip文件内容比較类
- ArcGIS API for JavaScript 4.2学习笔记[13] Layer的弹窗(PopupTemplate)
- SpringMVC 实现文件上传与下载,并配置异常页面
- Spring系列(七) Spring MVC 异常处理
- pyqt-QGrapicsView 坐标系详解
- ExtJs4.2中Tab选项卡的右击关闭其它和关闭当前功能不准确的解决方法
- nodejs11安装教程(升级最新版本)
热门文章
- mysql--时区问题(时间差8个小时?修改Mysql 时区)
- day 27 网路编程 面向对象多继承
- 深度学习解决NLP问题:语义相似度计算
- word is too tall: try to use less letters, smaller font or bigger background 报错 java程序 验证码不显示
- 爬取豆瓣热销书榜前250 生成.csv文件
- PHP fsockopen受服务器KeepAlive影响的解决
- 大型情感剧集Selenium:6_selenium中的免密登陆与cookie操作 #华为云·寻找黑马程序员#
- 【nodejs原理&源码赏析(7)】【译】Node.js中的事件循环,定时器和process.nextTick
- [ch05-00] 多变量线性回归问题
- hibernate查询方式(四)