prometheus监控linux系统
2024-09-06 00:01:35
安装node exporter
创建Systemd服务

#vim /etc/systemd/system/node_exporter.service
[Unit]
Description=mysql_exporter
After=network.target
[Service]
Type=simple
User=prometheus
ExecStart=/usr/local/prom/exporter/node_exporter_0170/node_exporter
Restart=on-failure
[Install]
WantedBy=multi-user.target
启动node_exporter
# systemctl start node_exporter

# systemctl status node_exporter
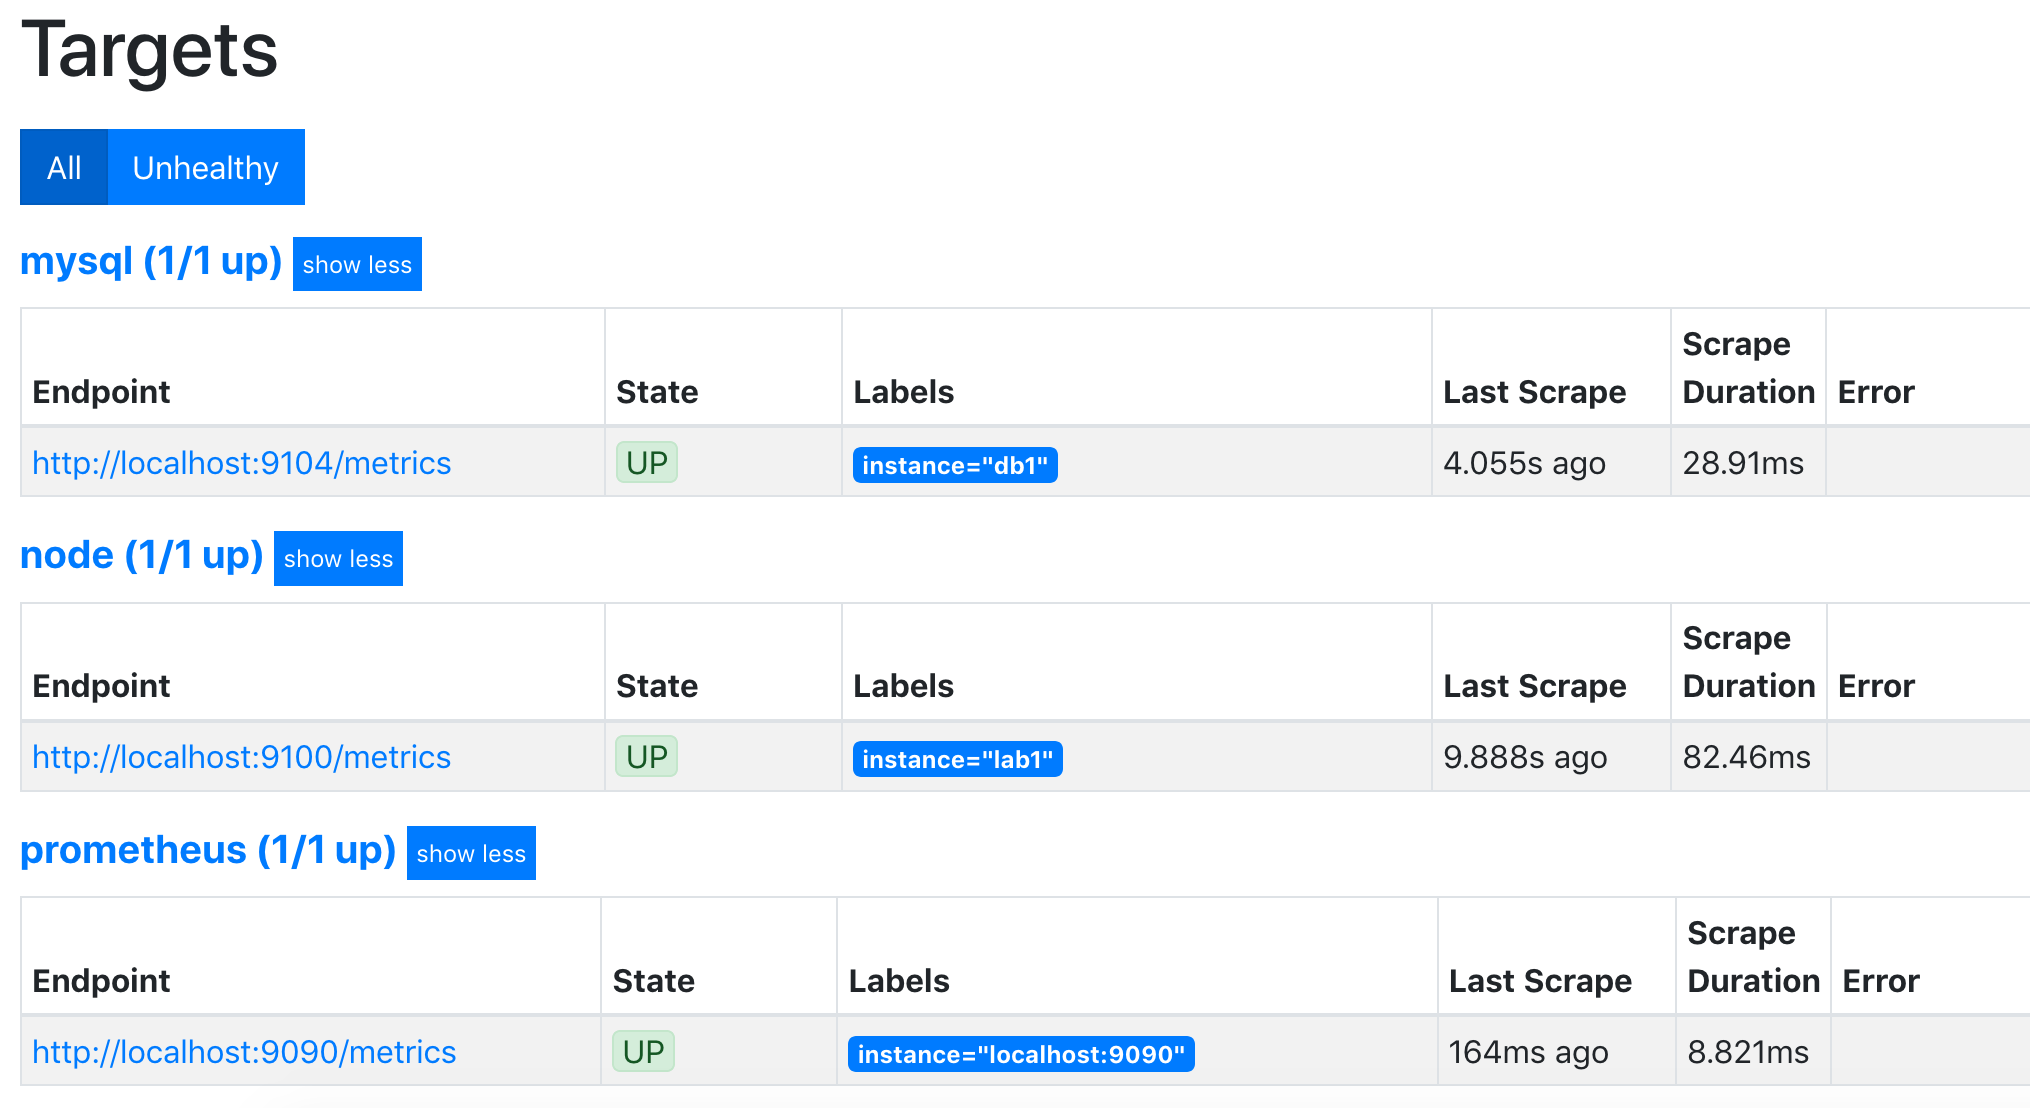
验证
curl http://localhost:9100/metrics
添加prometheus相关配置
# vi prometheus280/prometheus.yml

##linux##
  - job_name: 'node'
    static_configs:
    - targets: ['localhost:9100']
      labels:
          instance: lab1
重启prometheus即可
grafana dashboard
https://grafana.com/dashboards/8919
注意事项:
需要安装饼图的插件:
grafana-cli plugins install grafana-piechart-panel

# 请确保安装后能正常添加饼图。


需要重启grafanaservice grafana-server restart
https://github.com/starsliao/Prometheus
最新文章
- 编译器--__attribute__ ((packed))
- Angular工作笔记
- Hibernate之对象的三种状态
- 如何在iOS9的plist文件中配置不使用https
- java分享第三天(异常)
- python web框架——初识tornado
- 【转】C++11 标准新特性: 右值引用与转移语义
- c# Beginlnvoke 委托
- VirtualBox Headless启动虚拟机
- android studio中文乱码的解决方法【转】
- BZOJ 2435 NOI2011 道路建设 BFS/DFS
- Python [习题] 字典排序
- 简易机器学习代码(LR,Kmeans,NN,RNN)
- Mysql 查看连接数,状态 最大并发数(赞)
- LeetCode手记-Add Binary
- ubuntu18.04初始化配置
- Linux动态链接库的使用
- java WSDL接口webService实现方式
- Windows Server 2008 R2 WSUS服务器的详细配置和部署
- leetcode mock Shuffle an Array