Shadertoy 教程 Part 2 - 圆和动画
Note: This series blog was translated from Nathan Vaughn's Shaders Language Tutorial and has been authorized by the author. If reprinted or reposted, please be sure to mark the original link and description in the key position of the article after obtaining the author’s consent as well as the translator's. If the article is helpful to you, click this Donation link to buy the author a cup of coffee.
说明:该系列博文翻译自Nathan Vaughn的着色器语言教程。文章已经获得作者翻译授权,如有转载请务必在取得作者和译者同意之后在文章的重点位置标明原文链接以及说明。如果你觉得文章对你有帮助,点击此打赏链接请作者喝一杯咖啡。
朋友们,你们好!今天,我们将会学习如何用一个像素着色器在Shadertoy上画出一个圆并且使它动起来。
练习
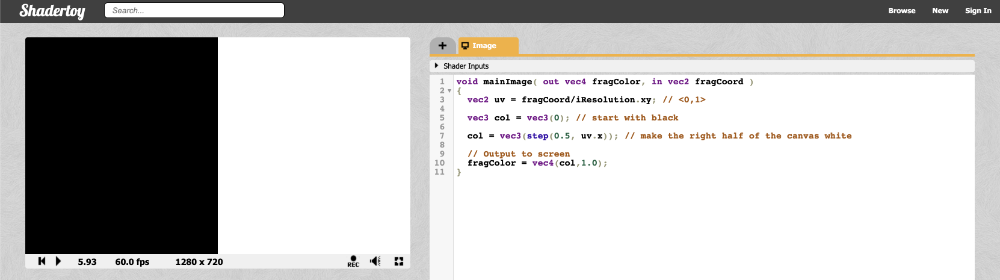
在我们画出第一个2D图形之前,让我们先用Shadertoy来做一些练习。新建一个着色器然后把下面的代码复制进去:
  void mainImage( out vec4 fragColor, in vec2 fragCoord )

{

  vec2 uv = fragCoord/iResolution.xy; // <0,1>

  vec3 col = vec3(0); // start with black

  if (uv.x > .5) col = vec3(1); // make the right half of the canvas white

  // Output to screen

  fragColor = vec4(col,1.0);

}
因为我们的着色器同时运行在每个像素上,所以我们需要用到if条件分支,根据每个像素的位置来绘制不同的颜色。你的着色器代码依赖于图形显卡和编译器,使用内置的函数如step会更合适。
让我们看看用step函数作为替换的例子吧:
  void mainImage( out vec4 fragColor, in vec2 fragCoord )

{

  vec2 uv = fragCoord/iResolution.xy; // <0,1>

  vec3 col = vec3(0); // start with black

  col = vec3(step(0.5, uv.x)); // make the right half of the canvas white

  // Output to screen

  fragColor = vec4(col,1.0);

}
画布的左侧会变成黑色,而右侧会变成白色。
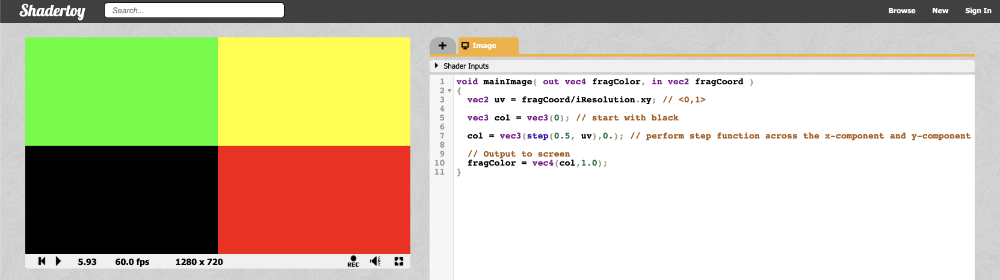
step函数接收两个参数:一个边界值和对比值。如果函数中的第二个参数大于第一个,它返回1,否则返回0。你也可以把step的返回值作为一个向量中的若干个元素值应用:
void mainImage( out vec4 fragColor, in vec2 fragCoord )

{

  vec2 uv = fragCoord/iResolution.xy; // <0,1>

  vec3 col = vec3(0); // start with black

  col = vec3(step(0.5, uv), 0); // perform step function across the x-component and y-component of uv

  // Output to screen

  fragColor = vec4(col,1.0);

}
因为step函数同时处理canvas上的 X和Y元素,所以你可以看到canvas被分成了四个颜色块:
绘制圆形
下面是定义一个圆的基础公式:
x^2 + y^2 = r^2

  x = x- 图像上的坐标值

  y = y- 图像上的坐标值

  r = 圆的半径
我们重新调整变量的位置,让这个等式为0:
x^2 + y^2 - r^2 = 0
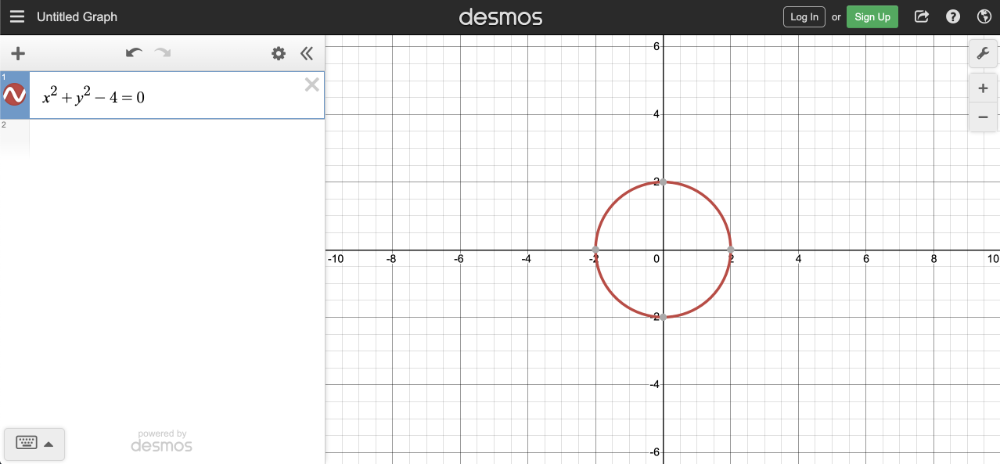
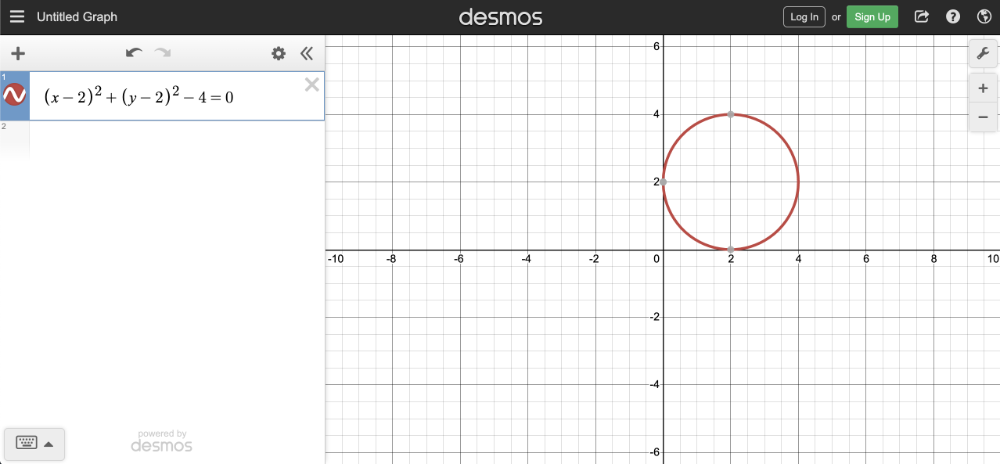
想要用图形的方式展示这套公式,你可以使用 Desmos calculator 帮助你完成公式的图像化:
x^2 + y^2 - 4 = 0
把上面这段代码粘贴之后复制到Desmos calculator中,你就能看到一个半径为2的圆形,圆的中心点的位置是坐标原点(0, 0);
在Shadertoy中,我们使用上面的公式来画一个圆。首先创建一个sdfCircle函数,这个函数会在XY坐标大于0的时候返回白色,反之则返回蓝色。
sdf函数引用了符号距离场函数(signed distance functions[SDF])的概念。SDF经常用来绘制3D图形,但我们这里也可以用它来绘制2D图形。我们在新建的mainImage函数中调用它们:
vec3 sdfCircle(vec2 uv, float r) {

    float x = uv.x;

    float y = uv.y;

    float d = length(vec2(x, y)) - r;

    return d > 0. ? vec3(1.) : vec3(0., 0., 1.);

}

void mainImage( out vec4 fragColor, in vec2 fragCoord )

{

  vec2 uv = fragCoord/iResolution.xy; // <0,1>

  vec3 col = sdfCircle(uv, .2); // Call this function on each pixel to check if the coordinate lies inside or outside of the circle

  // Output to screen

  fragColor = vec4(col,1.0);

}
也许你会觉得奇怪,为什么我要在数字0之后加上一个小数点呢?这是因为加一个小数点可以把整数型的数字转换成浮点型的数字。当我们在调用需要传入浮点型参数的函数时,在整数后面添加一个“点”能够确保编译器会正确编译我们的代码。
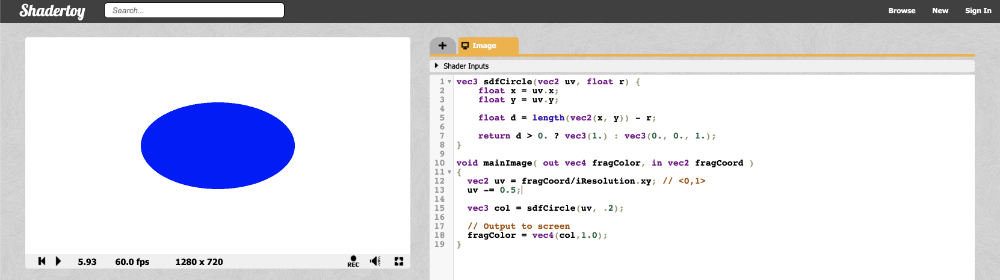
我们把半径设置为0.2因为坐标系统的UV值是在0到1之间,运行代码,你会注意到我们的图形好像有点问题:
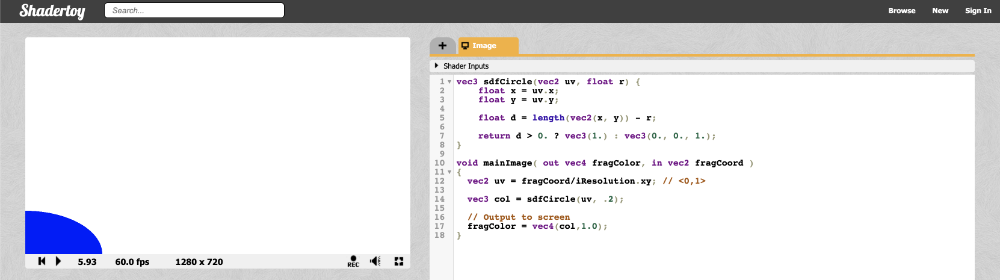
看起来像只是一个处在画布左下角的四分之一的圆形。造成这种现象的原因是我们的画布初始原点坐标是在左下角。我们需要把XY坐标偏移0.5,使其能够位于画布的正中心:
UV坐标值减去0.5
  vec2 uv = fragCoord/iResolution.xy; // <0,1>

  uv -= 0.5; // <-0.5, 0.5>
现在,画布上X轴和Y轴的坐标范围为-0.5和0.5,意味着坐标的原点就在画布的中心。但是,我们又遇到了一个新的问题:
我们的圆有点被拉伸了,看起来更像一个椭圆。造成这种现象的原因是画布的宽高比率。当画布的宽度和高度不同时,我们的圆就会被拉伸。解决方案是用UV中的X坐标乘以画布宽高比率:
  vec2 uv = fragCoord/iResolution.xy; // <0,1>

  uv -= 0.5; // <-0.5, 0.5>

  uv.x *= iResolution.x/iResolution.y; // fix aspect ratio
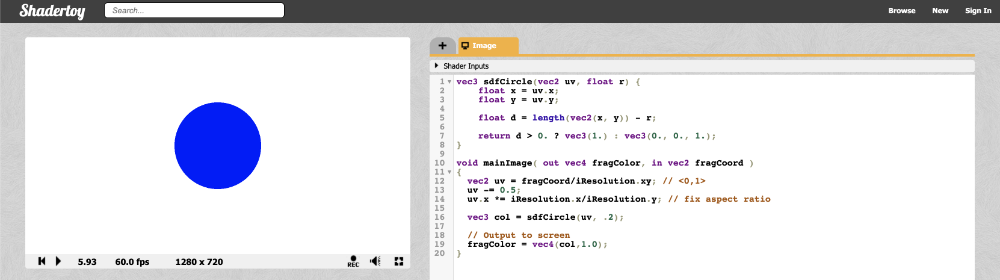
这意味着X轴的范围不再是-0.5到0.5之间了,而是根据你的浏览器和界面(界面的宽度有可能因为开启了调试模式而窄)的宽度,自动适应画布的宽高比率的一个比例值。最后的代码应该是这个样子的:
  vec3 sdfCircle(vec2 uv, float r) {

    float x = uv.x;

    float y = uv.y;

    float d = length(vec2(x, y)) - r;

    return d > 0. ? vec3(1.) : vec3(0., 0., 1.);

 }

void mainImage( out vec4 fragColor, in vec2 fragCoord )

{

  vec2 uv = fragCoord/iResolution.xy; // <0,1>

  uv -= 0.5;

  uv.x *= iResolution.x/iResolution.y; // fix aspect ratio

  vec3 col = sdfCircle(uv, .2);

  // Output to screen

  fragColor = vec4(col,1.0);

}
运行以上代码,你就可以看到一个完美比例的蓝色的圆了!
提示: 这仅仅是绘制一个圆形方式之一。在第四节教程中,我们将会学习到另外一个方法,这种方法不仅仅能够帮我们绘制圆,也可以绘制其他图形。
现在我们来点乐子吧!我们可以使用全局变量iTime来变换圆的颜色。使用余弦(cos)函数,我们就能重复地变化一组颜色。因为余弦函数的波幅是在-1到1之间,所以我们需要将其进行调整到0到1之间。
别忘了,片着色器最后输出的颜色值都会在0到1之间。如果颜色值小于0,它会自动转化为0,如果大于1,它会为我们自动转化为1。通过调整区间范围,我们就能得到一个比较宽泛的颜色值范围。
  vec3 sdfCircle(vec2 uv, float r) {

  float x = uv.x;

  float y = uv.y;

  float d = length(vec2(x, y)) - r;

  return d > 0. ? vec3(0.) : 0.5 + 0.5 * cos(iTime + uv.xyx + vec3(0,2,4));

}

void mainImage( out vec4 fragColor, in vec2 fragCoord )

{

  vec2 uv = fragCoord/iResolution.xy; // <0,1>

  uv -= 0.5;

  uv.x *= iResolution.x/iResolution.y; // fix aspect ratio

  vec3 col = sdfCircle(uv, .2);

  // Output to screen

  fragColor = vec4(col,1.0);

}
运行以上的代码,你就能看到一个在多个颜色之间变化圆。
你是不是对uv.xyx这种语法感到困惑?这种语法叫做Swizzling。我们可以声明一个包含多个元素的向量。如下:
  vec3 col = vec3(0.2, 0.4, 0.6);

  vec3 col2 = col.xyx;

  vec3 col3 = vec3(0.2, 0.4, 0.2);
在上面这段代码片段中,col2和 col3 是一样的效果。
让圆动起来
要让圆动起来,我们需要在圆的公式里面为X和Y坐标设置一个偏移值。因此,将等式修改成下面这样:
  (x - offsetX)^2 + (y - offsetY)^2 - r^2 = 0

  x = x-coordinate on graph

  y = y-coordinate on graph

  r = radius of circle

  offsetX = how much to move the center of the circle in the x-axis

  offsetY = how much to move the center of the circle in the y-axis
我们把代码复制到 Desmos calculator 中去,就可以看到图形化的结果了:
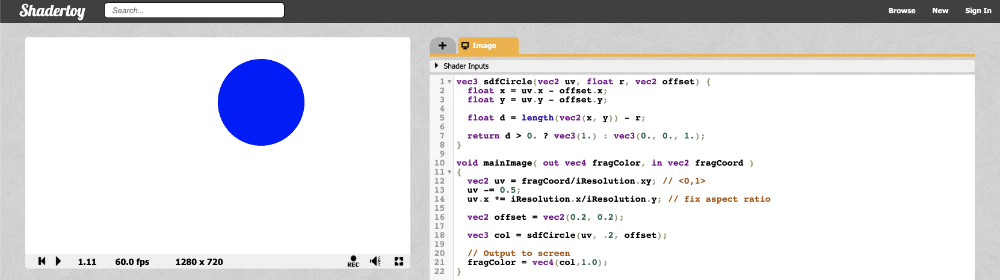
在Shadertoy中,我们通过调整sdfCircle函数适应偏移值,然后使圆向右上角移动了0.2:
  vec3 sdfCircle(vec2 uv, float r, vec2 offset) {

  float x = uv.x - offset.x;

  float y = uv.y - offset.y;

  float d = length(vec2(x, y)) - r;

  return d > 0. ? vec3(1.) : vec3(0., 0., 1.);

}

void mainImage( out vec4 fragColor, in vec2 fragCoord )

{

  vec2 uv = fragCoord/iResolution.xy; // <0,1>

  uv -= 0.5;

  uv.x *= iResolution.x/iResolution.y; // fix aspect ratio

  vec2 offset = vec2(0.2, 0.2); // move the circle 0.2 units to the right and 0.2 units up

  vec3 col = sdfCircle(uv, .2, offset);

  // Output to screen

  fragColor = vec4(col,1.0);

}
使用全局变量iTime让画布获得生机,让圆动起来。
  vec3 sdfCircle(vec2 uv, float r, vec2 offset) {

  float x = uv.x - offset.x;

  float y = uv.y - offset.y;

  float d = length(vec2(x, y)) - r;

  return d > 0. ? vec3(1.) : vec3(0., 0., 1.);

}

void mainImage( out vec4 fragColor, in vec2 fragCoord )

{

  vec2 uv = fragCoord/iResolution.xy; // <0,1>

  uv -= 0.5;

  uv.x *= iResolution.x/iResolution.y; // fix aspect ratio

  vec2 offset = vec2(sin(iTime*2.)*0.2, cos(iTime*2.)*0.2); // move the circle clockwise

  vec3 col = sdfCircle(uv, .2, offset);

  // Output to screen

  fragColor = vec4(col,1.0);

}
以上代码会让圆沿着一个圆形的轨道,以画布原点为中心顺时钟旋转。给iTime乘以一个值,就可以调整动画的速率。给正弦和余弦返回的值乘以一个值,就可以调整运动的幅度。后面我们将会经常会将正弦、余弦函数和iTime变量一起使用。因为它们会产生共鸣!
总结
本节教程,我们学会了如果修正画布的坐标系统,画一个圆形,然后让它沿着圆形轨道动起来。圆!圆!圆!。在下一节课中,我将会向你展示如何绘制一个方块,然后让它旋转起来!
最新文章
- php 导出excle的.csv格式的数据时乱码问题
- C#通过事件跨类调用WPF主窗口中的控件
- 用jquery怎么实现点击显示,再一次点击隐藏
- Nodejs学习笔记(七)--- Node.js + Express 构建网站简单示例
- protocol(协议)的一些要点
- [ CodeVS冲杯之路 ] P1053
- 处理MVC中默认的Json方法返回时间的问题
- 关于IE打印预览内容显示不全的问题解决
- 关于Two-Pass标记连通域个数
- .Net程序员学用Oracle系列(19):我知道的导出和导入
- iOS回顾笔记(06) -- AutoLayout从入门到精通
- iOS-硬件授权检测【通讯录、相机、相册、日历、麦克风、定位授权】
- poj 3268 Silver Cow Party(最短路dijkstra)
- freebsd 记录点
- C++函数装饰器
- MySQL远程连接失败(错误码:2003)
- .net面试问答
- Zepto tap 穿透bug、解决移动端点击穿透问题
- Linux 服务器命令,持续更新……
- CentOS下的yum upgrade和yum update区别