Matlab的2D作图
2024-09-02 13:58:40
1 plot()函数
画一条线
plot(X,Y)
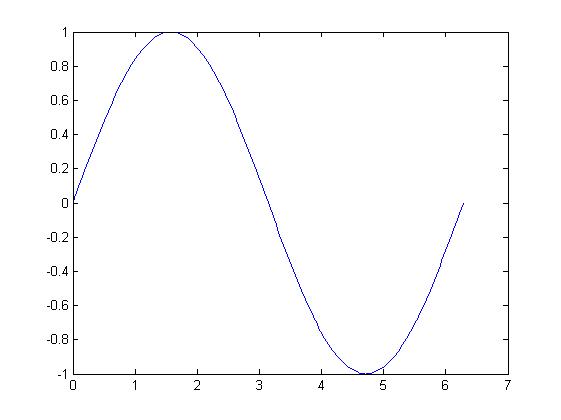
最基本的例子
x = 0: pi / 100:2 * pi;

y = sin(x);

figure

plot(x,y)
在一张图上画多条线
clc;

clear;

x = linspace(-2 * pi,2 * pi);

y1 = sin(x);

y2 = cos(x);

figure

plot(x,y1,x,y2)

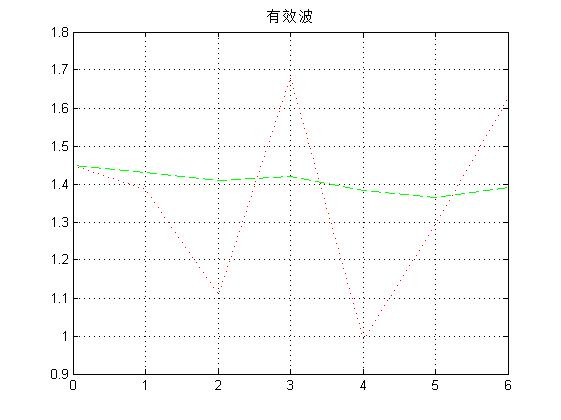
2 Matlab绘制两个图
Matlab可以使用figure(1), figure(2)作多幅图
clc;

clear;

buoy_effective_wave = [1.45

1.43

1.41

1.42

1.382

1.364

1.39

];

radar_effective_wave = [1.44846

1.38654

1.1079

1.68066

0.9918

1.29366

1.62648

];

figure(1);

x = 0 : 6;

plot(x,buoy_effective_wave,'g--',x,radar_effective_wave,'r:');

title('有效波');

grid on;

buoy_wave_crest_week=[36.69

36.21

37.32

36.79

36.773

36.091

37.03];

radar_wave_crest_week=[35.8

33

46.5

38.7

36.6

30.2

39.5];

figure(2);

x = 0 : 6;

plot(x,buoy_wave_crest_week,'g--',x,radar_wave_crest_week,'r:');

title('波峰周');

grid on;

buoy_wave_crest=[111.268

110.972

112.153

112.484

110.495

112.951

117.189

];

radar_wave_crest=[88.48

68.35

102.16

85.16

90.62

103.49

91.32

];

figure(3);

x = 0 : 6;

plot(x,buoy_wave_crest,'g--',x,radar_wave_crest,'r:');

title('波峰峰');

grid on;


参考资料:
1 https://www.cnblogs.com/stxs/p/8617140.html
最新文章
- UE4 VR GUI实现 参考(UMG AND VR)
- php返回json数据简单实例
- 【Android】源码external/目录中在编译过程中生成的文件列表
- UVA 11551 - Experienced Endeavour(矩阵高速幂)
- How to use pagination in Magento
- 关于SYN洪泛攻击简介
- 复杂SQL代码实例
- springboot 1.5.2 thymeleaf 添加templates 静态资源访问路径
- C# 获取并判断操作系统版本,解决Win10、 Windows Server 2012 R2 读取失败的方案
- Ionic3学习笔记(十一)实现省市区三级联动
- jQuery操作input改变value属性值
- 分布式_zookeeper
- string find()函数
- Python类和实例方法和属性的动态绑定
- Why is it called “armature” instead of “skeleton”? or perhaps “rig”?
- 5.7 C++函数调用操作符重载
- MySQL-MMM实现MySQL高可用
- Android webView打不开baidu网页的解决办法
- bug3 乱码问题
- HDU 1757 A Simple Math Problem (矩阵乘法)