Machine learning 第8周编程作业 K-means and PCA
2024-10-16 03:44:03
1.findClosestCentroids
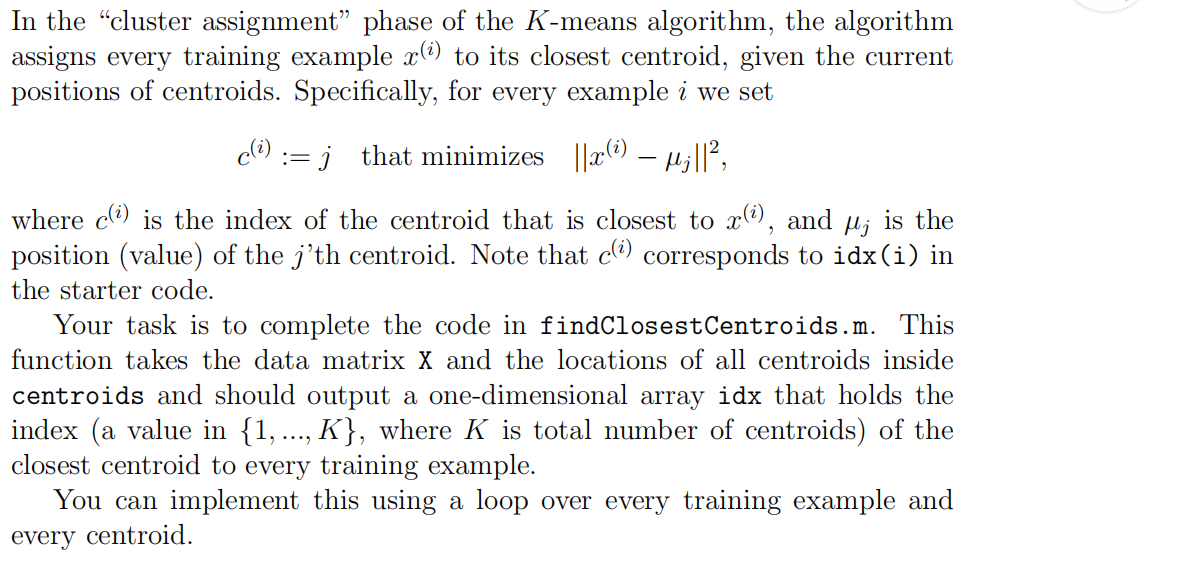
function idx = findClosestCentroids(X, centroids)

%FINDCLOSESTCENTROIDS computes the centroid memberships for every example

%   idx = FINDCLOSESTCENTROIDS (X, centroids) returns the closest centroids

%   in idx for a dataset X where each row is a single example. idx = m x 1

%   vector of centroid assignments (i.e. each entry in range [1..K])

%

% Set K

K = size(centroids, 1);

% You need to return the following variables correctly.

idx = zeros(size(X,1), 1);

% ====================== YOUR CODE HERE ======================

% Instructions: Go over every example, find its closest centroid, and store

%               the index inside idx at the appropriate location.

%               Concretely, idx(i) should contain the index of the centroid

%               closest to example i. Hence, it should be a value in the

%               range 1..K

%

% Note: You can use a for-loop over the examples to compute this.

%

for i=1:size(X,1),

  for j=1:K,

    dis(j)=sum( (centroids(j,:)-X(i,:)).^2, 2 );

  endfor

  [t,idx(i)]=min(dis);

endfor

% =============================================================

end
2.computerCentroids

function centroids = computeCentroids(X, idx, K)

%COMPUTECENTROIDS returns the new centroids by computing the means of the

%data points assigned to each centroid.

%   centroids = COMPUTECENTROIDS(X, idx, K) returns the new centroids by

%   computing the means of the data points assigned to each centroid. It is

%   given a dataset X where each row is a single data point, a vector

%   idx of centroid assignments (i.e. each entry in range [1..K]) for each

%   example, and K, the number of centroids. You should return a matrix

%   centroids, where each row of centroids is the mean of the data points

%   assigned to it.

%

% Useful variables

[m n] = size(X);

% You need to return the following variables correctly.

centroids = zeros(K, n);

% ====================== YOUR CODE HERE ======================

% Instructions: Go over every centroid and compute mean of all points that

%               belong to it. Concretely, the row vector centroids(i, :)

%               should contain the mean of the data points assigned to

%               centroid i.

%

% Note: You can use a for-loop over the centroids to compute this.

%

for i=1:K,

  ALL=0;

  cnt=sum(idx==i);

  temp=find(idx==i);

  for j=1:numel(temp),

    ALL=ALL+X(temp(j),:);

  endfor

  centroids(i,:)=ALL/cnt;

endfor

% =============================================================

end
3.pca
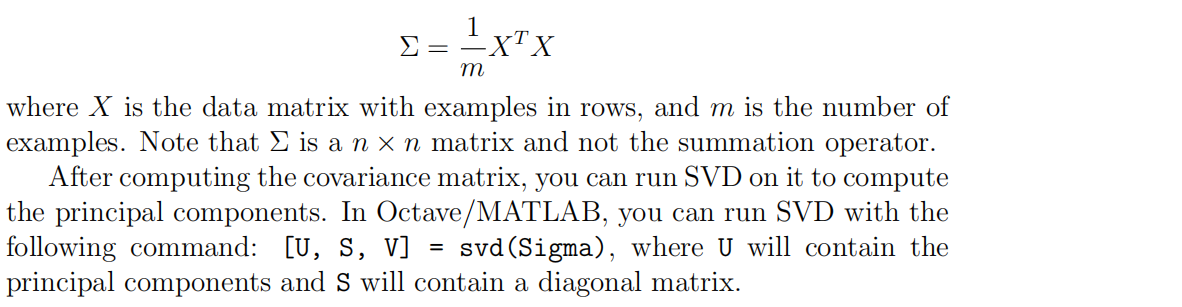
function [U, S] = pca(X)

%PCA Run principal component analysis on the dataset X

%   [U, S, X] = pca(X) computes eigenvectors of the covariance matrix of X

%   Returns the eigenvectors U, the eigenvalues (on diagonal) in S

%

% Useful values

[m, n] = size(X);

% You need to return the following variables correctly.

U = zeros(n);

S = zeros(n);

% ====================== YOUR CODE HERE ======================

% Instructions: You should first compute the covariance matrix. Then, you

%               should use the "svd" function to compute the eigenvectors

%               and eigenvalues of the covariance matrix.

%

% Note: When computing the covariance matrix, remember to divide by m (the

%       number of examples).

%

Sigma=(X'*X)./m;

[U,S,V]=svd(Sigma);

% =========================================================================

end
4.projectData
function Z = projectData(X, U, K)

%PROJECTDATA Computes the reduced data representation when projecting only

%on to the top k eigenvectors

%   Z = projectData(X, U, K) computes the projection of

%   the normalized inputs X into the reduced dimensional space spanned by

%   the first K columns of U. It returns the projected examples in Z.

%

% You need to return the following variables correctly.

Z = zeros(size(X, 1), K);

% ====================== YOUR CODE HERE ======================

% Instructions: Compute the projection of the data using only the top K

%               eigenvectors in U (first K columns).

%               For the i-th example X(i,:), the projection on to the k-th

%               eigenvector is given as follows:

%                    x = X(i, :)';

%                    projection_k = x' * U(:, k);

%

U_reduce=U(:,1:K);

Z=X*U_reduce;

% =============================================================

end
5.recoverData
function X_rec = recoverData(Z, U, K)

%RECOVERDATA Recovers an approximation of the original data when using the

%projected data

%   X_rec = RECOVERDATA(Z, U, K) recovers an approximation the

%   original data that has been reduced to K dimensions. It returns the

%   approximate reconstruction in X_rec.

%

% You need to return the following variables correctly.

X_rec = zeros(size(Z, 1), size(U, 1));

% ====================== YOUR CODE HERE ======================

% Instructions: Compute the approximation of the data by projecting back

%               onto the original space using the top K eigenvectors in U.

%

%               For the i-th example Z(i,:), the (approximate)

%               recovered data for dimension j is given as follows:

%                    v = Z(i, :)';

%                    recovered_j = v' * U(j, 1:K)';

%

%               Notice that U(j, 1:K) is a row vector.

%

X_rec=Z*U(:,1:K)';

% =============================================================

end
最新文章
- httpModules与Http模块
- Ajax 文件上传
- Java for LeetCode 214 Shortest Palindrome
- 苹果开发者账号注册&真机调试
- asp.net zip 压缩传输
- svn is already under version control问题解决
- JS面向对象思想(OOP)
- [Mugeda HTML5技术教程之17] 理解Mugeda访问统计结果
- Greenplum+Hadoop学习笔记-14-定义数据库对象之创建与管理模式
- parseSdkContent failed 解决方案
- HTML5原生拖拽/拖放⎡Drag & Drop⎦详解
- 图解HTTP,TCP,IP,MAC的关系
- linux和sqlserver 2017的安装
- LeetCode - 503. Next Greater Element II
- HDU1114(KB12-F DP)
- 自适应界面开发总结——WPF客户端开发
- 【转】Vim自动补全插件----YouCompleteMe安装与配置
- Java开发工程师(Web方向) - 01.Java Web开发入门 - 第3章.Tomcat
- AUC ROC PR曲线
- fis难用的地方
热门文章
- 在使用html5的video标签播放视频时为何只有声音却没有图像
- 2018.09.30 bzoj3551:Peaks加强版(dfs序+主席树+倍增+kruskal重构树)
- 2018.09.25 bzoj3572: [Hnoi2014]世界树(虚树+树形dp)
- spring boot web项目在IDEA下热部署解决办法(四步搞定)
- bootstrap-treeview的 简单使用
- AE IRasterCursor 获取栅格图层像素值
- (能被11整除的数的特征)The shortest problem --hdu
- PAT甲 1046. Shortest Distance (20) 2016-09-09 23:17 22人阅读 评论(0) 收藏
- HDU1241 Oil Deposits 2016-07-24 13:38 66人阅读 评论(0) 收藏
- DFS剪枝处理HDU1010