Grafana + Prometheus 监控JVM
最近在研究监控系统,所以第一次接触了Grafana跟Prometheus,Grafana是一个很强大的可视化指标工具,而Prometheus是一个时序数据库。
项目总会慢慢做大,一些必要的监控以及预警是很有必要的。
所以研究了下JVM的监控,可以有以下两种方式,Grafana官网上有很多共享的展示面板模板,可看哪个更符合自己的需求,当然也可以自己创建。
首先安装Grafana跟Prometheus,这个比较简单,可自行百度。
1.Jmx_exporter + Prometheus +Grafana
1.1下载Jmx_exporter架包:https://github.com/prometheus/jmx_exporter
1.2在配置Jmx_exporter的config.yaml:
---

lowercaseOutputLabelNames: true

lowercaseOutputName: true

whitelistObjectNames: ["java.lang:type=OperatingSystem"]

blacklistObjectNames: []

rules:

  - pattern: 'java.lang<type=OperatingSystem><>(committed_virtual_memory|free_physical_memory|free_swap_space|total_physical_memory|total_swap_space)_size:'

    name: os_$1_bytes

    type: GAUGE

    attrNameSnakeCase: true

  - pattern: 'java.lang<type=OperatingSystem><>((?!process_cpu_time)\w+):'

    name: os_$1

    type: GAUGE

    attrNameSnakeCase: true
1.3启动你的应用:java -javaagent:./jmx_prometheus_javaagent-0.12.0.jar=8698:config.yaml -jar yourJar.jar
我使用的是springboot,所以加运行参数即可。

1.4配置Promethus的config:
scrape_configs:

  # The job name is added as a label `job=<job_name>` to any timeseries scraped from this config.

  - job_name: 'prometheus'

    # metrics_path defaults to '/metrics'

    # scheme defaults to 'http'.

    static_configs:

    - targets: ['localhost:9090']

  - job_name: 'monitor-demo'

    # metrics_path defaults to '/metrics'

    # scheme defaults to 'http'.

    static_configs:

    - targets: ['localhost:8698']
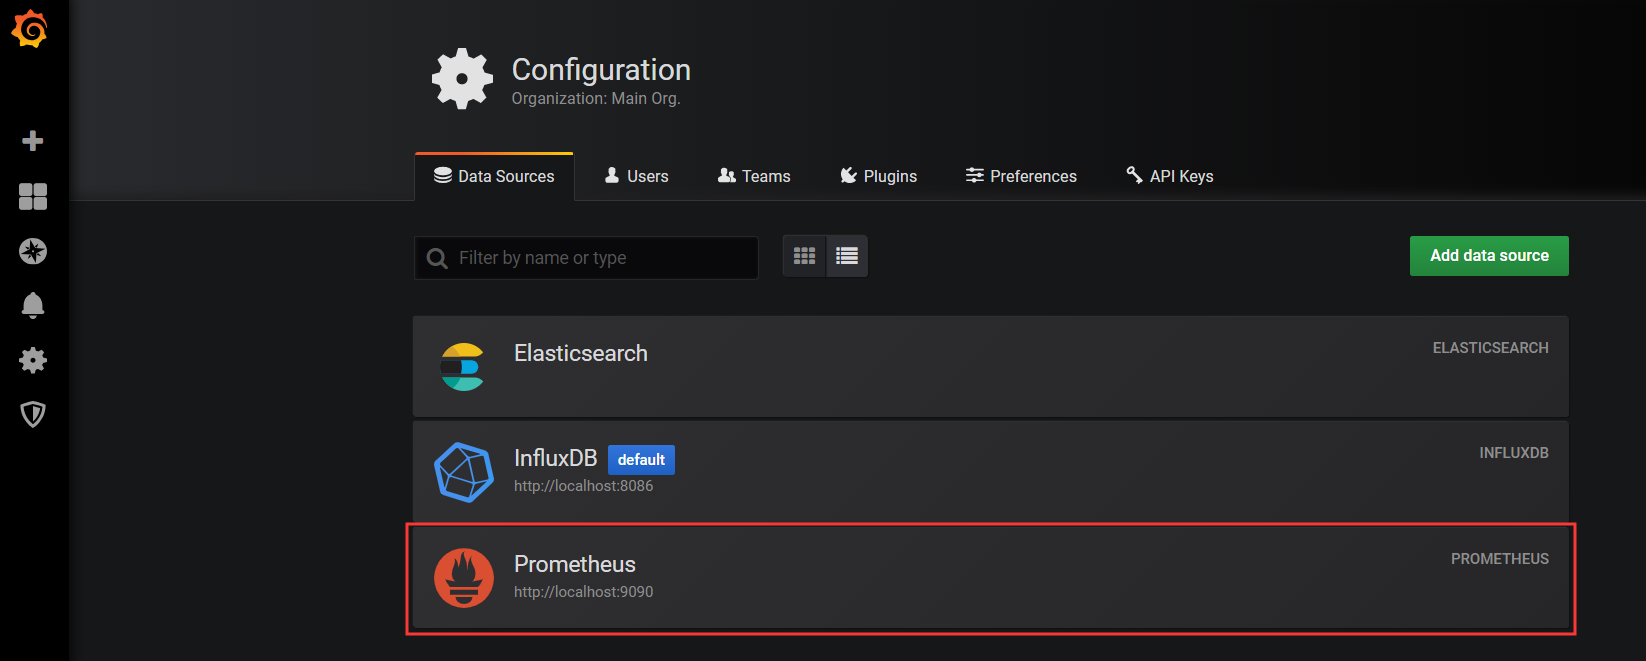
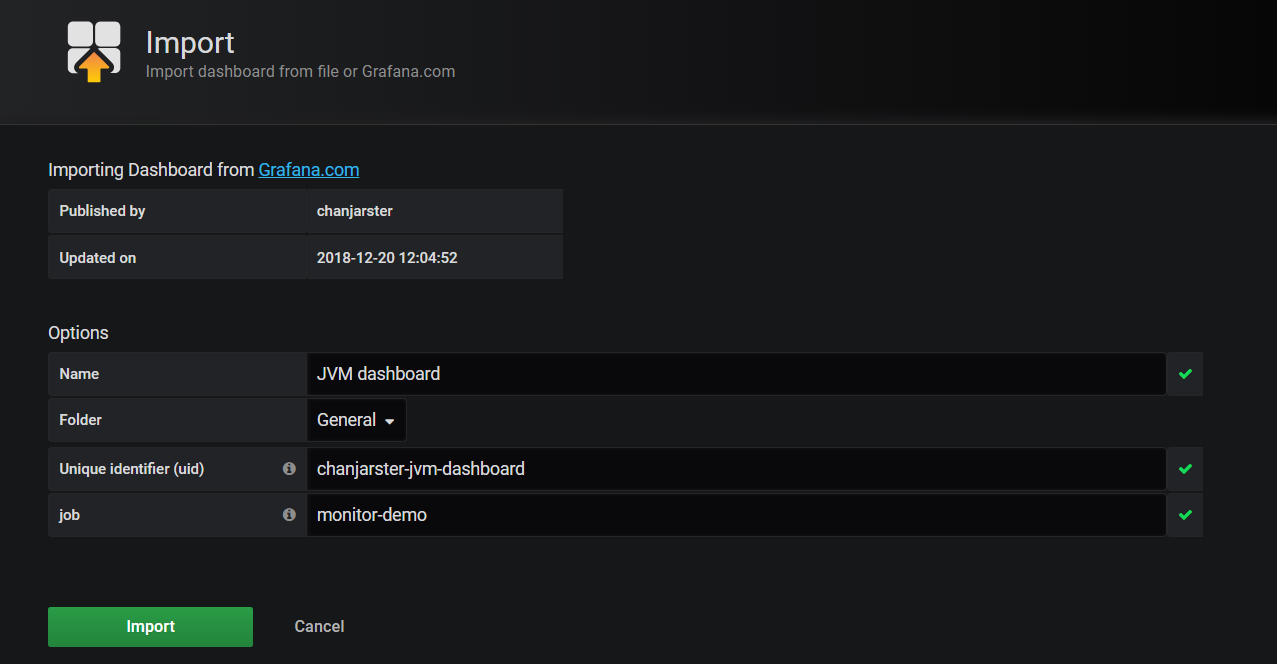
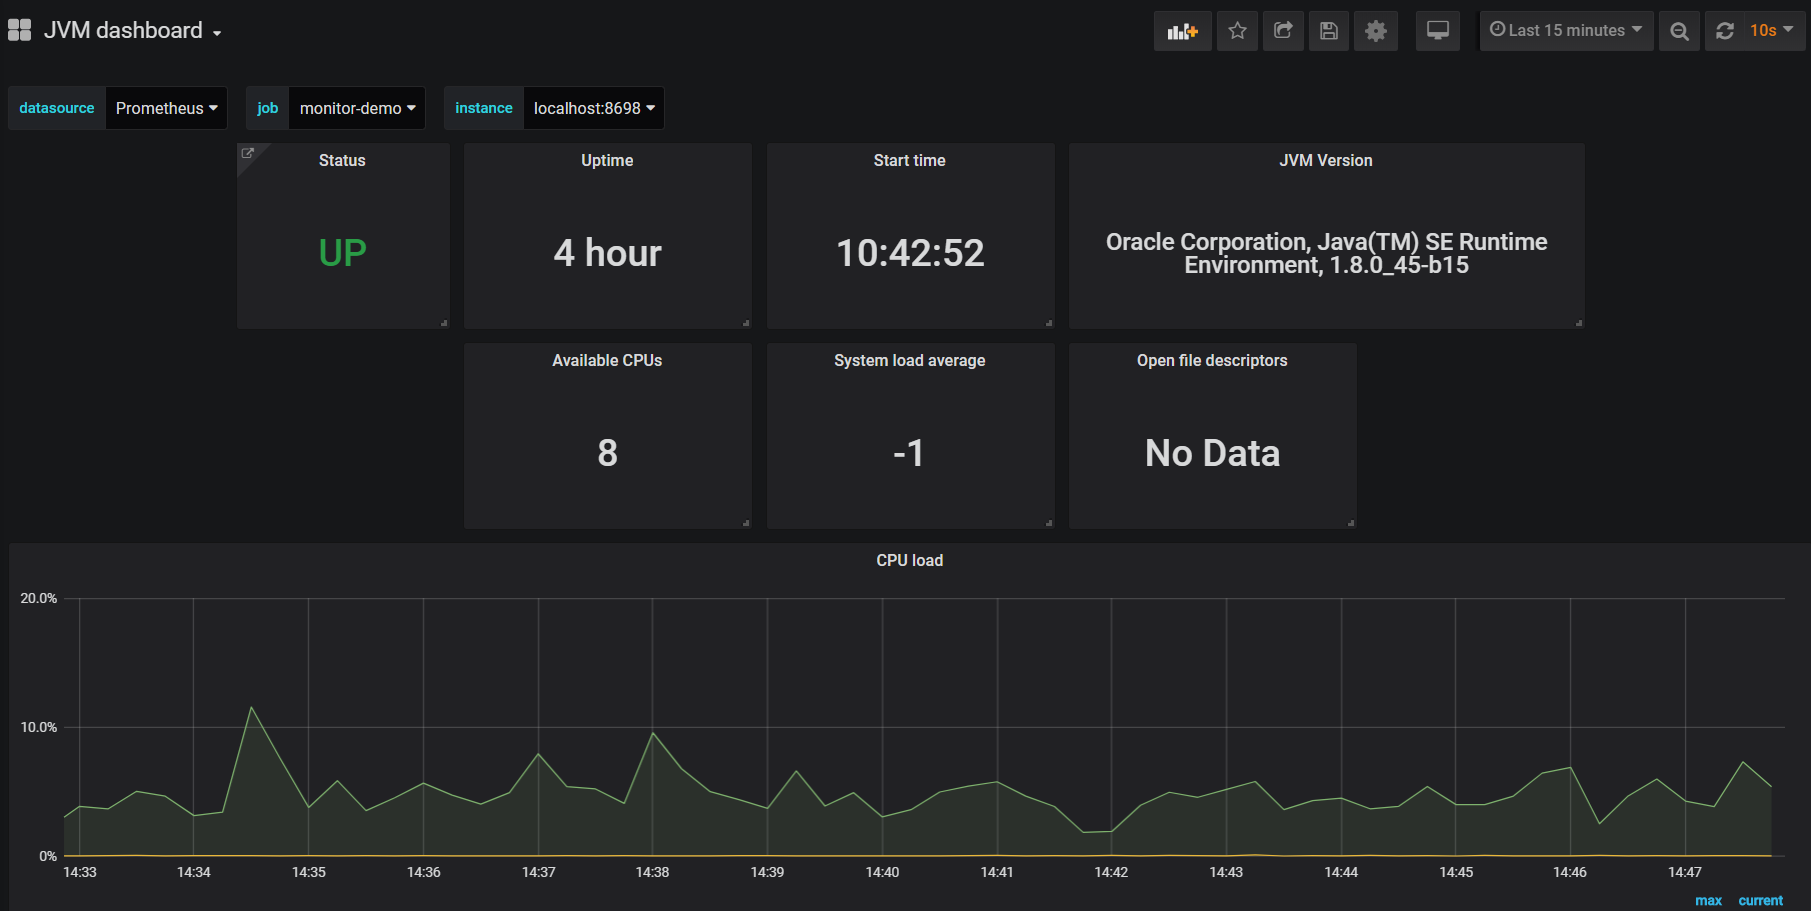
1.5Grafana我使用的是模板是8563,直接Import就好,在Import之前应首先在Grafana创建Promethus的数据源
https://grafana.com/grafana/dashboards/8563
2.Micrometer + Prometheus +Grafana
上面的方面,不够灵活,不能定制收集指标,而使用Micrometer则比较灵活,可以定制自己想要的指标,而不仅仅是JVM,还可以是自己应用的指标,但在这里暂时不详述。
可以到这篇文章了解一下:
https://www.cnblogs.com/rolandlee/p/11343848.html
这里使用Grafana模板是4701
https://grafana.com/grafana/dashboards/4701
2.1 maven所需要的到依赖
      <dependency>

            <groupId>org.springframework.boot</groupId>

            <artifactId>spring-boot-starter-actuator</artifactId>

        </dependency>

        <dependency>

            <groupId>io.micrometer</groupId>

            <artifactId>micrometer-registry-prometheus</artifactId>

            <version>1.2.2</version>

        </dependency>

        <dependency>

            <groupId>io.github.mweirauch</groupId>

            <artifactId>micrometer-jvm-extras</artifactId>

            <version>0.2.0</version>

        </dependency>
2.2application.properties配置(注意,这里没有配置management.endpoints.web.base-path,所以默认的请求路径是/actuator,而Promethus的路径是/actuator/prometheus)
server.port=8699

#spring.application.name=JVM-micrometer

management.metrics.tags.application=JVM-micrometer

#prometheus配置

management.metrics.export.prometheus.enabled=true

management.metrics.export.prometheus.step=1ms

management.metrics.export.prometheus.descriptions=true

management.endpoint.prometheus.enabled=true

management.endpoints.web.exposure.include=health,info,env,prometheus,metrics,httptrace,threaddump,heapdump,springmetrics
2.3配置Prometheus的config:
    - job_name: 'actuator-demo'

    # metrics_path defaults to '/metrics'

    # scheme defaults to 'http'.

    metrics_path: '/actuator/prometheus'

    static_configs:

    - targets: ['localhost:8699']
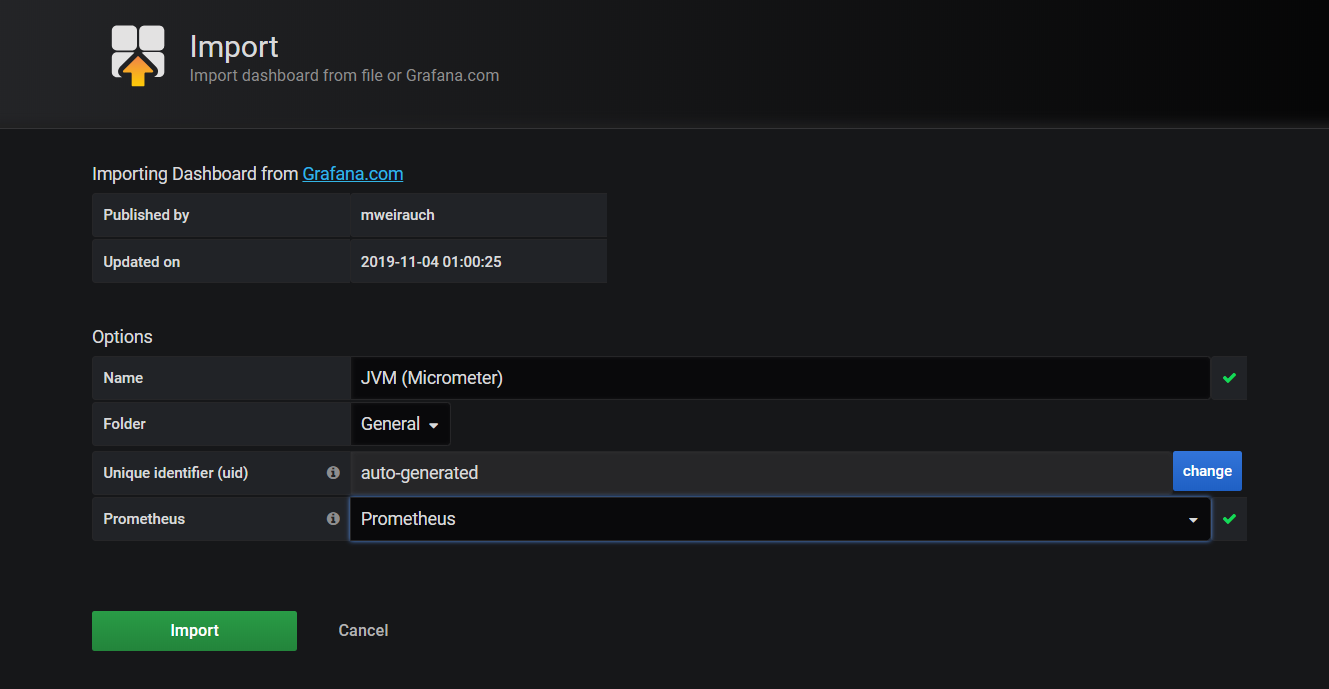
2.4在Grafana上Import4701即可
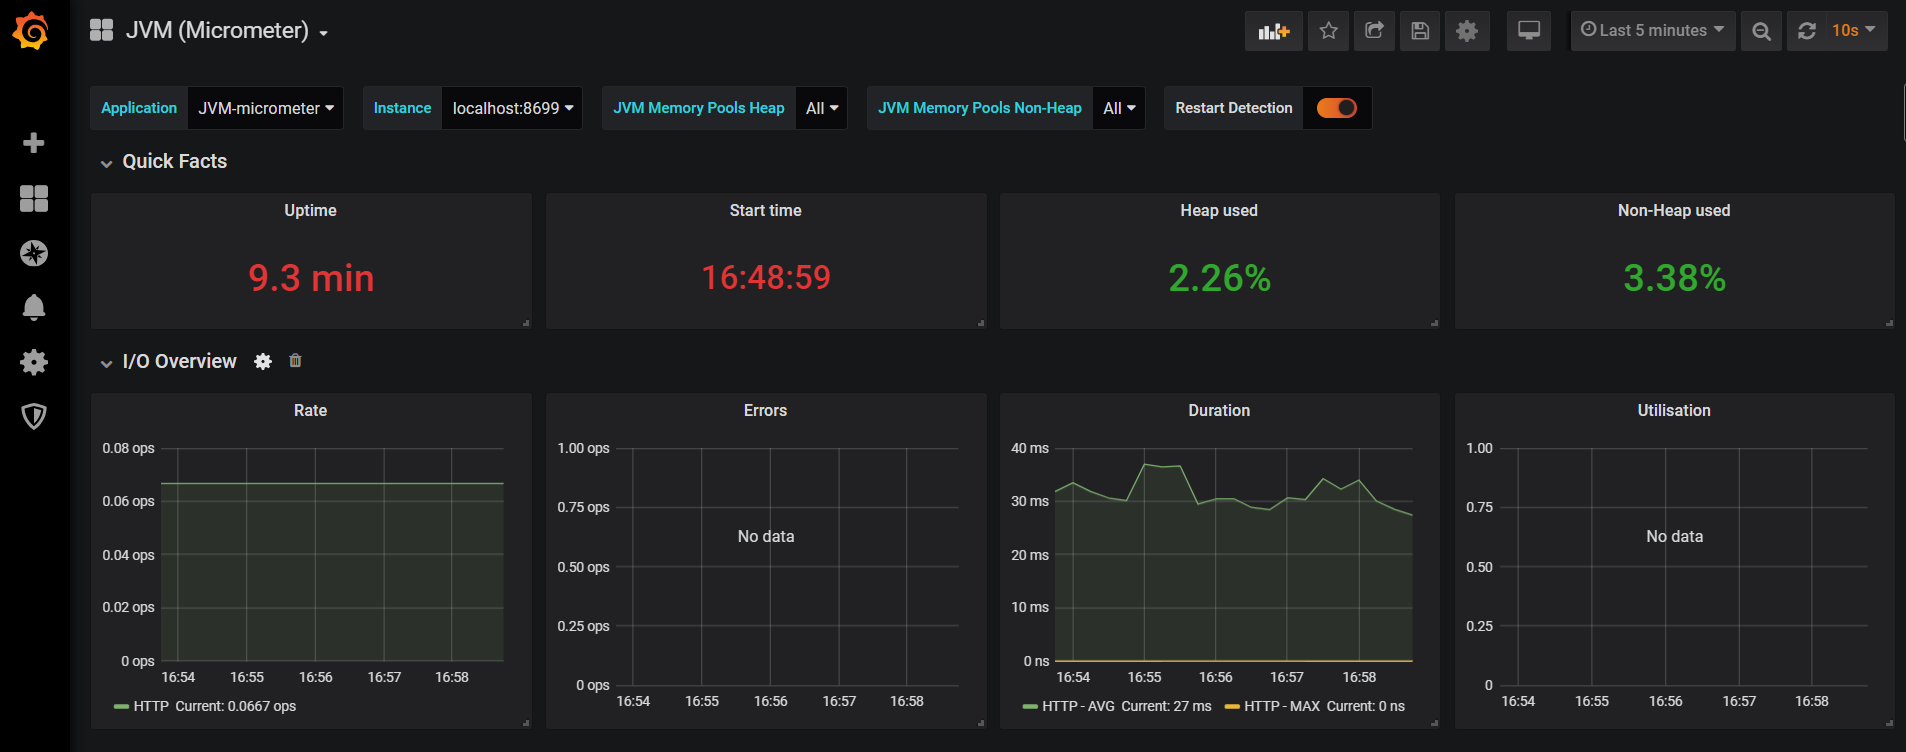
至此监控JVM系统就搭建起来了,比较简单。
最新文章
- 三剑客之SED
- C++中extern关键字用法小结
- 关于QT写注册表开机自启动
- 【GoLang】函数作为 类型 和 值
- nginx lua整合安装
- python爬虫抓取数据
- R语言与正态性检验
- 第一百九十六天 how can I 坚持
- 【个人笔记】002-PHP基础-01-PHP快速入门-02-PHP语言相关介绍输
- spring+mybatis的优缺点
- C#创建微信自定义菜单
- boost::function实践——来自《Beyond the C++ Standard Library ( An Introduction to Boost )》
- Spark算子--flatMapValues
- [PHP]curl上传多文件
- Python 简单soket例子
- Robust Real-time Object Detection学习
- Ubuntu18.04更换国内源
- python使用mysql数据库(转)
- c++第五天:默认初始化
- 阿里java面试题
热门文章
- ubutu22.04开启ssh配置
- css小技巧【让背景最少是屏幕高度】【让三个字和四个字左右对齐】
- javascript的布尔运算符
- CSS:盒子_每个元素都有两个盒子(《CSS世界》笔记-块级元素)
- python连接数据库系列
- 启动项目报错org.yaml.snakeyaml.scanner.ScannerException: while scanning for the next token found character ‘@‘
- 报错信息;Cannot execute request on any known server 解决;sprigcloud;跑本地但是服务一直在eureka
- ROS自动检测安装功能依赖包
- unity 扇形范围检测目标
- NVIDIA显卡安装