highcharts PHP中使用
2024-08-31 06:59:02
官网
https://www.hcharts.cn/demo/highcharts
html
<div id="container" style="min-width:400px;height:400px"></div>
js
Highcharts.chart('container', {

	chart: {

		plotBackgroundColor: null,

		plotBorderWidth: null,

		plotShadow: false,

		type: 'pie'

	},

	title: {

		text: '2018年1月浏览器市场份额'

	},

	tooltip: {

		pointFormat: '{series.name}: <b>{point.percentage:.1f}%</b>'

	},

	plotOptions: {

		pie: {

			allowPointSelect: true,

			cursor: 'pointer',

			dataLabels: {

				enabled: true,

				format: '<b>{point.name}</b>: {point.percentage:.1f} %',

				style: {

					color: (Highcharts.theme && Highcharts.theme.contrastTextColor) || 'black'

				}

			}

		}

	},

	series: [{

		name: 'Brands',

		colorByPoint: true,

		data: [{

			name: 'Chrome',

			y: 61.41,

			sliced: true,

			selected: true

		}, {

			name: 'Internet Explorer',

			y: 11.84

		}, {

			name: 'Firefox',

			y: 10.85

		}, {

			name: 'Edge',

			y: 4.67

		}, {

			name: 'Safari',

			y: 4.18

		}, {

			name: 'Sogou Explorer',

			y: 1.64

		}, {

			name: 'Opera',

			y: 1.6

		}, {

			name: 'QQ',

			y: 1.2

		}, {

			name: 'Other',

			y: 2.61

		}]

	}]

});
这里的数据通常都是从数据库查询处理出来的。
而它的格式是json的格式。
所以通过ajax获取比较方便一些。
public function get_series_data() {

        if ($date = $_POST['date']) {

            $sql = 'select count(*) as count ,appid from tf_bag_lucky_log where is_receive=1 and add_time > '.strtotime($date." 00:00").' and add_time < '.strtotime($date ." 23:59").' group by appid order by count desc';

        } else {

            $sql = 'select count(*) as count ,appid from tf_bag_lucky_log where is_receive=1 group by appid order by count desc';

        }

        // 统计

        $data_list = Db::query($sql);

        $series_data = [];

        foreach ($data_list as $k=>&$v) {

            $xcx_info = Db::name('xcx')->where('appid',$v['appid'])->find();

            if ($k == 0) {

                $series_data[$k] = [

                    'name' => $xcx_info['name'],

                    'y' => $v['count'],

                    'sliced' => true,

                    'selected' => true,

                ];

            } else {

                $series_data[$k] = [

                    'name' => $xcx_info['name'],

                    'y' => $v['count'],

                ];

            }

        }

        $this->json->setErr(0, '操作成功');

        $this->json->setAttr('data', $series_data);

        $this->json->Send();

}
js改造
showContainer(date);
function showContainer(date) {
$.ajax({
url: "get_series_data",
data: {
"date" : date,
},
type: "POST",
dataType: "json",
success: function (data) {
Highcharts.chart('container', {
chart: {
plotBackgroundColor: null,
plotBorderWidth: null,
plotShadow: false,
type: 'pie'
},
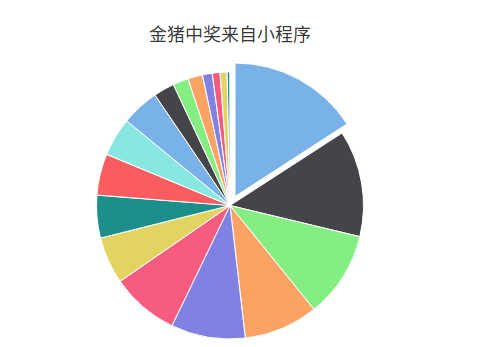
title: {
text: '金猪中奖来自小程序'
},
tooltip: {
pointFormat: '{series.name}: <b>{point.percentage:.1f}%</b>'
},
plotOptions: {
pie: {
allowPointSelect: true,
cursor: 'pointer',
dataLabels: {
enabled: false
},
showInLegend: true
}
},
series: [{
name: '占比',
colorByPoint: true,
data: data.data,
// data: [{
// name: 'Chrome',
// y: 1000,
// sliced: true,
// selected: true
// }, {
// name: 'Internet Explorer',
// y: 11.84
// }, {
// name: 'Firefox',
// y: 10.85
// }, {
// name: 'Edge',
// y: 4.67
// }, {
// name: 'Safari',
// y: 4.18
// }, {
// name: 'Other',
// y: 7.05
// }]
}],
});
},
error: function () {
alert("网络错误");
}
});
highcharts 非常灵活,非常方便。ajax,json获取数据,效果刚刚的。
最新文章
- eclipse版本发展历史
- RSA 加解密算法
- 改善C#程序的建议3:在C#中选择正确的集合进行编码
- iOS 9适配技巧
- html embed用法
- struts2的记住账号密码的登录设计
- iOS开发系列--打造自己的“美图秀秀”
- word中创建文本框
- Core dotnet 命令大全
- Java的一些基础小知识之JVM与GC (转)
- ASP.NET Core Web API 索引 (更新Identity Server 4 视频教程)
- Oracle 10.2.0.5升级至11.2.0.4
- IDEA Spring注入显示红色波浪线
- Hadoop HA方案调研
- VS 编译后 install报错(error MSB3073)
- 批处理最完整人性化教程(.bat文件语法)
- centos6.5 手动安装gcc
- LoadRunner-循环
- VS2010编译和运行项目错误
- 蓝桥杯 方格填数 DFS 全排列 next_permutation用法
热门文章
- [LeetCode] 721. Accounts Merge_Medium tag: DFS recursive
- Summary: difference between public, default, protected, and private key words
- Django初级手册1-项目和应用的创建与简单的数据库操作
- Rpgmakermv(4 )doc of TerraxLights
- java的时间处理
- boostrap小图标
- zw版【转发·台湾nvp系列Delphi例程】HALCON TestRegionPoint1
- Visual Studio 2013旗舰版KEY
- HashMap、HashTable、ConcurrentHashMap的区别
- Linux基础命令---gunzip